


Financial Highlights
Latest Update : June 16, 2026
* MinebeaMitsumi has adopted International Financial Reporting Standards (IFRS) from the 1Q of FY3/2019.
- Annual
- Quarter
Financial Highlights
| FY3/2025
4Q | FY3/2026
1Q | FY3/2026
2Q | FY3/2026
3Q*1 | FY3/2026
4Q |
||
|---|---|---|---|---|---|---|
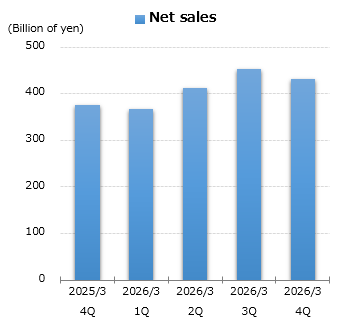
| Net sales | millions of yen | 374,823 | 366,925 | 411,389 | 453,921 | 432,152 |
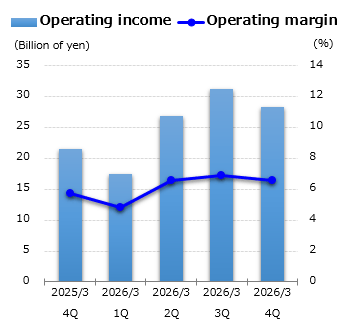
| Operating income | millions of yen | 21,531 | 17,432 | 26,955 | 31,289 | 28,303 |
| Operating margin | % | 5.7% | 4.8% | 6.6% | 6.9% | 6.5% |
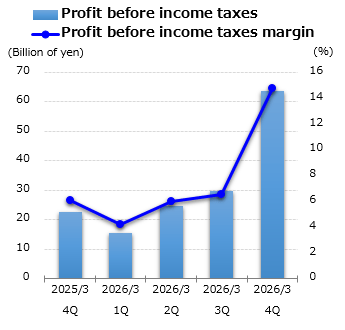
| Profit before income taxes | millions of yen | 22,682 | 15,589 | 24,781 | 29,753 | 63,656 |
| Profit before income taxes margin | % | 6.1% | 4.2% | 6.0% | 6.6% | 14.7% |
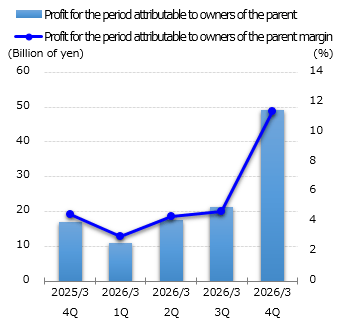
| Profit for the period attributable to owners of the parent | millions of yen | 16,966 | 10,889 | 17,696 | 21,268 | 49,181 |
| Profit for the period attributable to owners of the parent margin | % | 4.5% | 3.0% | 4.3% | 4.7% | 11.4% |
Per Share
| FY3/2025
4Q | FY3/2026
1Q | FY3/2026
2Q | FY3/2026
3Q*1 | FY3/2026
4Q |
||
|---|---|---|---|---|---|---|
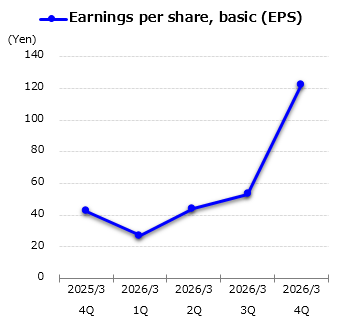
| Earnings per share, basic (EPS) | yen | 42.25 | 27.12 | 44.07 | 52.96 | 122.46 |
| Earnings per share, diluted | yen | 42.25 | 27.11 | 44.06 | 52.96 | 122.46 |
| Cash dividends per share | yen | 25.00 | - | 25.00 | - | 25.00 |
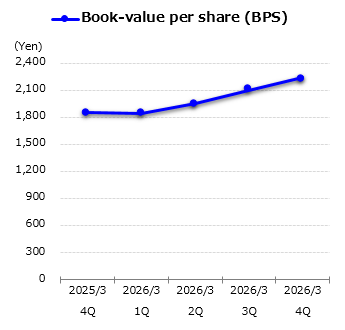
| Book-value per share (BPS) | yen | 1,851.29 | 1,845.65 | 1,952.43 | 2,103.93 | 2,238.50 |
| Total weighted average number of shares outstanding*2 | shares | 401,585,684 | 401,585,374 | 401,593,588 | 401,595,816 | 401,595,527 |
| Number of shares outstanding at the end of each period*2 | shares | 401,585,465 | 401,585,346 | 401,596,068 | 401,595,694 | 401,595,519 |
Performance Indicators
| FY3/2025
4Q | FY3/2026
1Q | FY3/2026
2Q | FY3/2026
3Q*1 | FY3/2026
4Q |
||
|---|---|---|---|---|---|---|
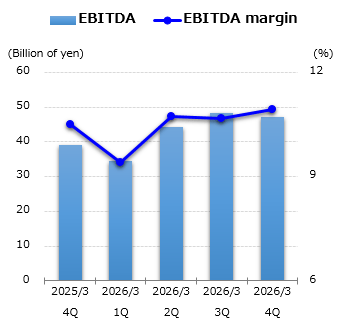
| EBITDA*3 | millions of yen | 39,225 | 34,511 | 44,193 | 48,422 | 47,275 |
| EBITDA margin*3 | % | 10.5% | 9.4% | 10.7% | 10.7% | 10.9% |
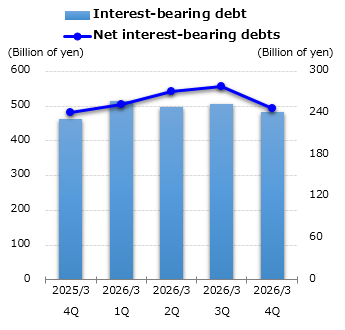
| Interest-bearing debt*4 | millions of yen | 463,597 | 515,489 | 498,454 | 506,908 | 482,491 |
| Net interest-bearing debts*4 | millions of yen | 241,449 | 252,685 | 271,017 | 278,551 | 246,784 |
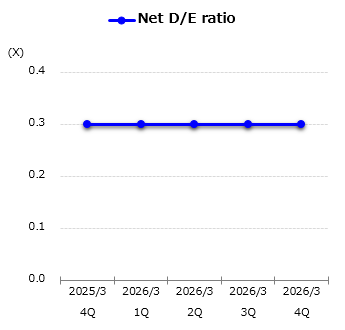
| Net D/E ratio*4 | X | 0.3 | 0.3 | 0.3 | 0.3 | 0.3 |
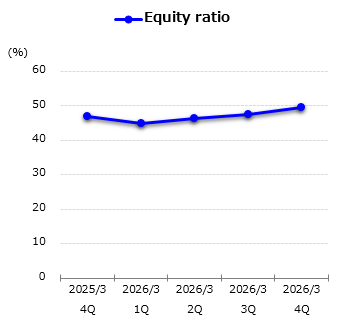
| Equity ratio | % | 46.9% | 45.0% | 46.3% | 47.4% | 49.5% |
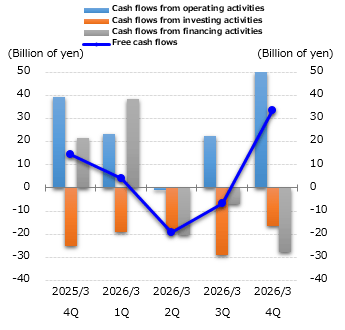
| Cash flows from operating activities | millions of yen | 39,450 | 23,293 | -951 | 22,491 | 50,017 |
| Cash flows from investing activities | millions of yen | -24,929 | -19,009 | -18,207 | -28,995 | -16,564 |
| Cash flows from financing activities | millions of yen | 21,463 | 38,554 | -20,162 | -6,985 | -27,540 |
| Free cash flows | millions of yen | 14,521 | 4,284 | -19,158 | -6,504 | 33,453 |
Expenditures etc
| FY3/2025
4Q | FY3/2026
1Q | FY3/2026
2Q | FY3/2026
3Q*1 | FY3/2026
4Q |
||
|---|---|---|---|---|---|---|
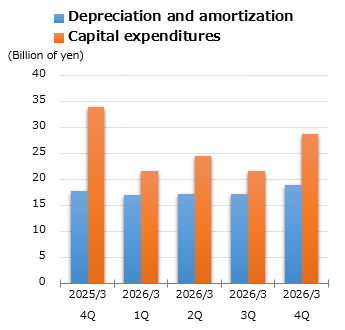
| Depreciation and amortization | millions of yen | 17,694 | 17,079 | 17,238 | 17,133 | 18,972 |
| Capital expenditures | millions of yen | 33,860 | 21,576 | 24,558 | 21,665 | 28,662 |
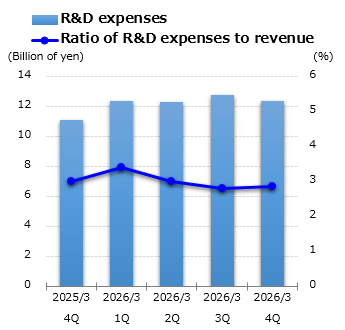
| R&D expenses | millions of yen | 11,103 | 12,343 | 12,327 | 12,737 | 12,348 |
| Ratio of R&D expenses to revenue | % | 3.0% | 3.4% | 3.0% | 2.8% | 2.9% |
- *1 Minebea Linear Motion Inc. (formerly TN Linear Motion Inc.) has been included in the scope of consolidation since October 3, 2025.
- *2 Number of outstanding shares : Total number of shares issued - Treasury stock
- *3 EBITDA : Operating income + Depreciation and amortization
- *4 Net interest-bearing debts = "Bonds and borrowings" - ("Cash and cash equivalents" + Time deposit more than 3 months)


