


Consolidated Sales and Profit Forecast
Latest Update : June 16, 2026
* MinebeaMitsumi has adopted International Financial Reporting Standards (IFRS) from the 1Q of FY3/2019.
Forecast for the FY3/2027
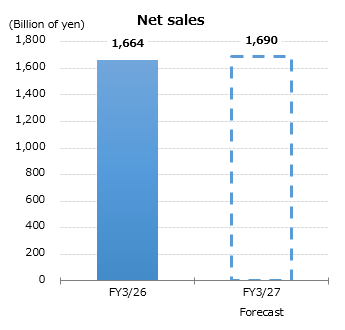
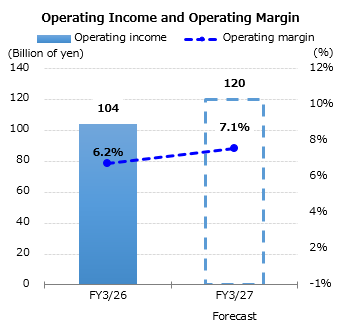
Regarding the earnings forecast for the fiscal year ending March 2027, we project net sales of ¥1.69 trillion and operating profit of ¥120 billion, supported by continued demand from data centers and growth in our core businesses.
We will continue to expand sales of high value-added products and implement profitability improvement initiatives to drive further growth. In addition, we aim to achieve a fourth consecutive year of sales and profit growth by capturing the benefits of our portfolio transformation and structural reforms.
| FY3/2026 Full Year Actual |
FY3/2027 | YoY Change |
||||
|---|---|---|---|---|---|---|
| 1H Forecast |
2H Forecast |
Full Year Forecast |
||||
| Net sales | billions of yen | 1,664.4 | 846.5 | 843.5 | 1,690.0 | 1.5% |
| Operating income | billions of yen | 104.0 | 53.0 | 67.0 | 120.0 | 15.4% |
| Operating margin | % | 6.2% | 6.3% | 7.9% | 7.1% | |
| Profit before income taxes | billions of yen | 133.8 | 49.0 | 63.0 | 112.0 | -16.3% |
| Profit before income taxes margin | % | 8.0% | 5.8% | 7.5% | 6.6% | |
| Profit for the period attributable to owners of the parent | billions of yen | 99.0 | 36.5 | 46.5 | 83.0 | -16.2% |
| Profit for the period attributable to owners of the parent margin | % | 6.0% | 4.3% | 5.5% | 4.9% | |
| Earnings per share, basic (EPS) | yen | 246.60 | 90.89 | 115.79 | 206.68 | -16.2% |
Forecast for the Consolidated Sales and Operating Income by Business Segment
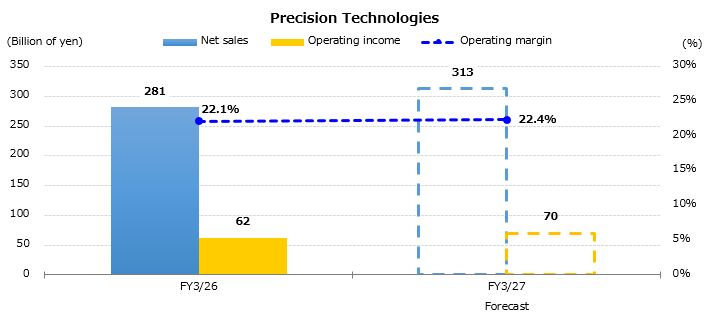
Precision Technologies (PT) segment is expected to continue driving profit growth, supported by strong demand for bearings, particularly from data center applications. To meet growing customer demand, we are steadily expanding production capacity while further strengthening our ability to provide high-quality products with a stable supply framework. In the aerospace business, we expect continued profit growth driven by robust aircraft demand, price adjustments, and enhanced production capabilities. Through these initiatives, we are targeting operating profit of ¥70 billion in FY3/2027 and aim to further expand earnings toward the ¥80 billion level over the mid-term.
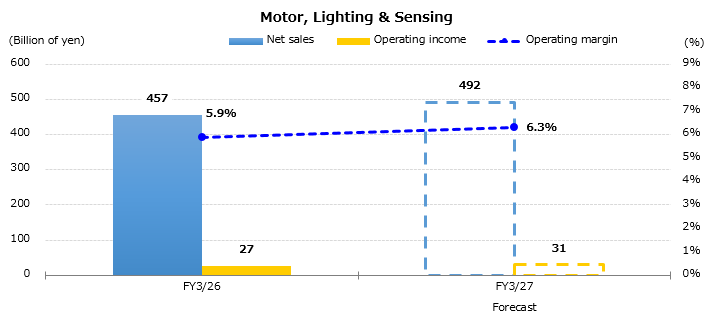
Motor, Lighting & Sensing (MLS) segment is seeing expanding opportunities for fan motors and other products driven by continued growth in the AI server market. We have completed capacity expansion investments for spindle motors used in helium HDDs, which are expected to contribute to earnings going forward. In addition, increased production of Battery Protection Modules and growth in sensing applications, including sensors for humanoid robots, are expected to support profitability. With multiple product lines contributing to growth, the segment is well positioned for further earnings expansion.
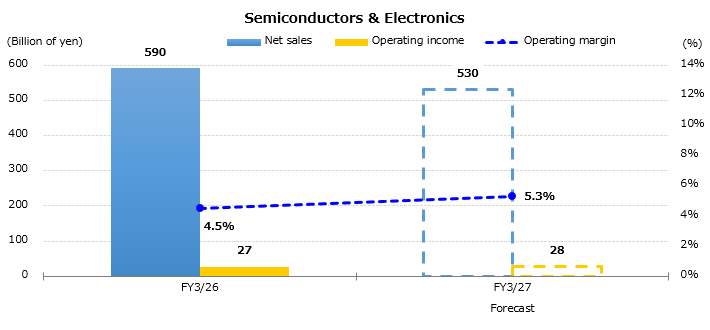
Semiconductor & Electronics (SE) segment is expected to see steady improvement in profitability, with monthly profitability at Shiga Plant now within sight and initiatives toward full profitability progressing. Expansion of MEMS sensors, power devices and foundry services is also expected to contribute to earnings improvement. We have redefined optical devices as strategic products and expect them, together with the semiconductor business, to drive growth across the segment.
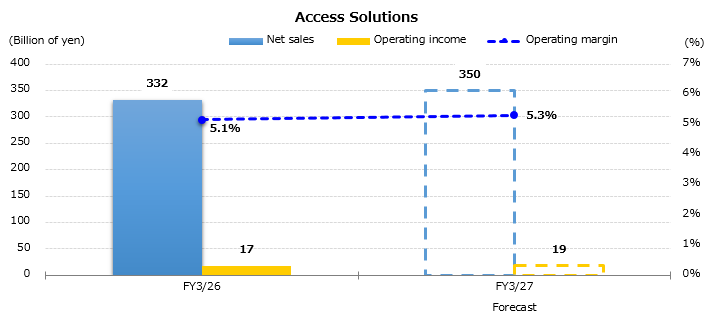
Access Solutions (AS) segment continues to face a challenging business environment due to changes in the Chinese market and uncertainty among OEM customers. However, we plan to achieve both sales and profit growth by expanding sales of products that leverage our core strengths, including wing handles and components for electric two-wheel vehicles. In addition, structural reforms at our European bases, including the closure of unprofitable locations, are expected to contribute to earnings improvement. We are continuing to strengthen the segment's ability to generate stable profits even under challenging market conditions.
| FY3/2026 Full Year Actual |
FY3/2027 | YoY Change |
||||
|---|---|---|---|---|---|---|
| 1H Forecast |
2H Forecast |
Full Year Forecast |
||||
| Net sales | billions of yen | 1,664.4 | 846.5 | 843.5 | 1,690.0 | 1.5% |
| Precision Technologies | billions of yen | 281.2 | 155.0 | 158.0 | 313.0 | 11.3% |
| Motor, Lighting & Sensing | billions of yen | 456.5 | 240.0 | 252.0 | 492.0 | 7.8% |
| Semiconductors & Electronics | billions of yen | 590.3 | 279.5 | 250.5 | 530.0 | -10.2% |
| Access Solutions | billions of yen | 332.2 | 170.0 | 180.0 | 350.0 | 5.3% |
| Others | billions of yen | 4.2 | 2.0 | 3.0 | 5.0 | 18.8% |
| Operating income | billions of yen | 104.0 | 53.0 | 67.0 | 120.0 | 15.4% |
| Precision Technologies | billions of yen | 62.2 | 34.5 | 35.5 | 70.0 | 12.5% |
| Motor, Lighting & Sensing | billions of yen | 26.9 | 13.0 | 18.0 | 31.0 | 15.1% |
| Semiconductors & Electronics | billions of yen | 26.7 | 14.0 | 14.0 | 28.0 | 5.0% |
| Access Solutions | billions of yen | 17.1 | 6.0 | 12.5 | 18.5 | 8.3% |
| Other | billions of yen | -2.7 | -1.0 | 0.0 | -1.0 | - |
| Adjustments | billions of yen | -26.3 | -13.5 | -13.0 | -26.5 | - |
Capital Expenditure, Depreciation, Research and Development Costs
| FY3/2026 Full Year Actual |
FY3/2027 Full Year Forecast |
YoY Change |
||
|---|---|---|---|---|
| Depreciation and amortization | billions of yen | 70.4 | 75.0 | 6.5% |
| Capital expenditures | billions of yen | 96.5 | 95.0 | -1.5% |
| R&D expenses | billions of yen | 49.8 | 51.0 | 2.5% |
Foreign Exchange
| FY3/2026 Full Year Actual |
FY3/2027 Full Year Assumption |
|||
|---|---|---|---|---|
| USD | PL | yen | 149.99 | 155.00 |
| BS | yen | 159.88 | 155.00 | |
| EUR | PL | yen | 172.92 | 182.50 |
| BS | yen | 183.41 | 182.50 | |
| THB | PL | yen | 4.63 | 4.85 |
| BS | yen | 4.86 | 4.85 | |
| CNY | PL | yen | 21.05 | 22.80 |
| BS | yen | 23.11 | 22.80 | |


