


Financial Highlights
Latest Update : June 16, 2026
* MinebeaMitsumi has adopted International Financial Reporting Standards (IFRS) from the 1Q of FY3/2019.
- Annual
- Quarter
Financial Highlights
| FY3/2022 | FY3/2023*1 | FY3/2024 | FY3/2025*2 | FY3/2026*6 | ||
|---|---|---|---|---|---|---|
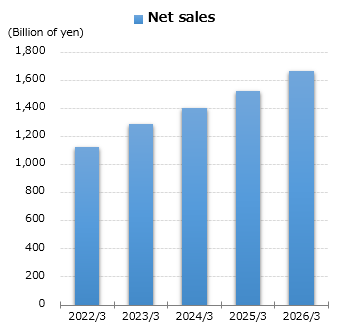
| Net sales | millions of yen | 1,124,140 | 1,292,203 | 1,402,127 | 1,522,703 | 1,664,387 |
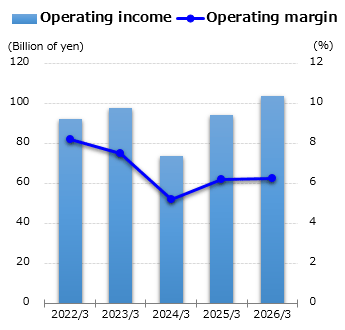
| Operating income | millions of yen | 92,136 | 97,530 | 73,536 | 94,482 | 103,979 |
| Operating margin | % | 8.2% | 7.5% | 5.2% | 6.2% | 6.2% |
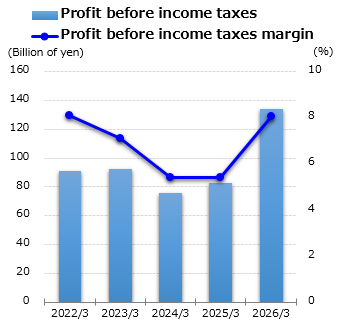
| Profit before income taxes | millions of yen | 90,788 | 92,128 | 75,545 | 82,609 | 133,779 |
| Profit before income taxes margin | % | 8.1% | 7.1% | 5.4% | 5.4% | 8.0% |
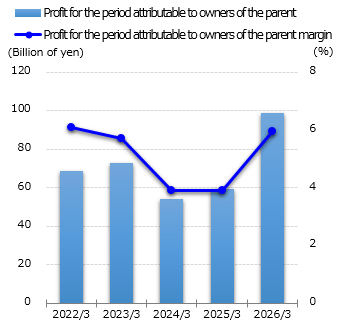
| Profit for the period attributable to owners of the parent | millions of yen | 68,935 | 73,152 | 54,035 | 59,457 | 99,034 |
| Profit for the period attributable to owners of the parent margin | % | 6.1% | 5.7% | 3.9% | 3.9% | 6.0% |
Per Share
| FY3/2022 | FY3/2023*1 | FY3/2024 | FY3/2025*2 | FY3/2026*6 | ||
|---|---|---|---|---|---|---|
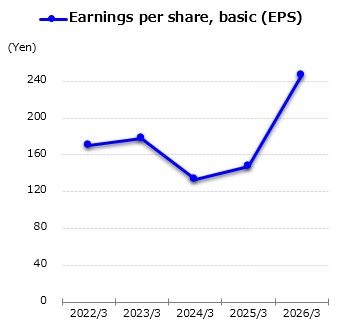
| Earnings per share, basic (EPS) | yen | 170.08 | 178.23 | 133.05 | 147.58 | 246.60 |
| Earnings per share, diluted | yen | 166.61 | 177.38 | 133.04 | 147.57 | 246.59 |
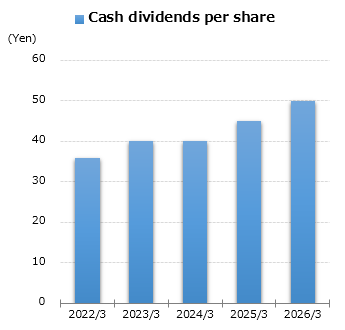
| Cash dividends per share | yen | 36.00 | 40.00 | 40.00 | 45.00 | 50.00 |
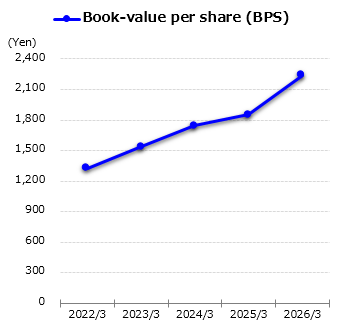
| Book-value per share (BPS) | yen | 1,326.15 | 1,540.53 | 1,741.25 | 1,851.29 | 2,238.50 |
| Total weighted average number of shares outstanding*3 | shares | 405,317,126 | 410,445,103 | 406,131,156 | 401,585,684 | 401,592,580 |
| Number of shares outstanding at the end of each period*3 | shares | 406,146,407 | 408,381,229 | 404,386,337 | 401,585,465 | 401,595,519 |
Performance Indicators
| FY3/2022 | FY3/2023*1 | FY3/2024 | FY3/2025*2 | FY3/2026*6 | ||
|---|---|---|---|---|---|---|
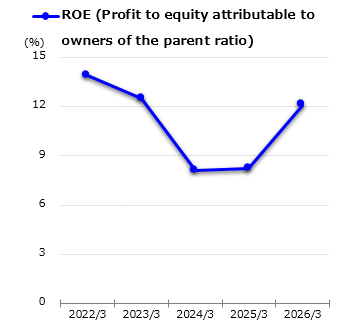
| ROE (Profit to equity attributable to owners of the parent ratio) | % | 13.9% | 12.5% | 8.1% | 8.2% | 12.1% |
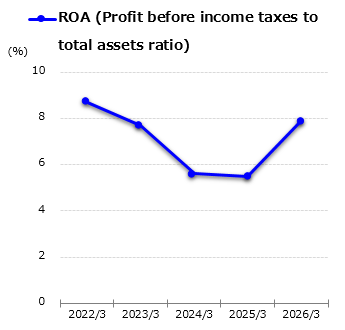
| ROA (Profit before income taxes to total assets ratio) | % | 8.7% | 7.7% | 5.6% | 5.5% | 7.9% |
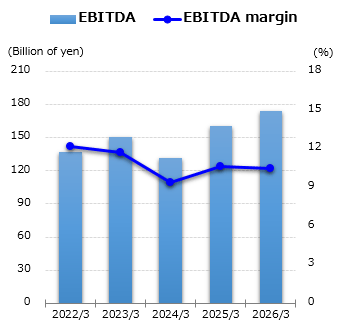
| EBITDA*4 | millions of yen | 137,367 | 150,552 | 131,895 | 160,688 | 174,401 |
| EBITDA margin*4 | % | 12.2% | 11.7% | 9.4% | 10.6% | 10.5% |
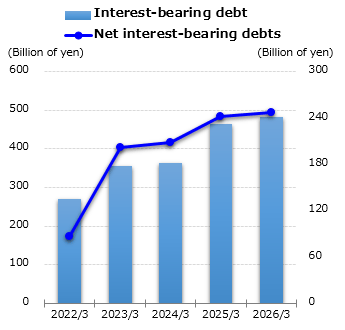
| Interest-bearing debt*5 | millions of yen | 270,711 | 354,331 | 362,383 | 463,597 | 482,491 |
| Net interest-bearing debts*5 | millions of yen | 86,931 | 201,671 | 208,564 | 241,449 | 246,784 |
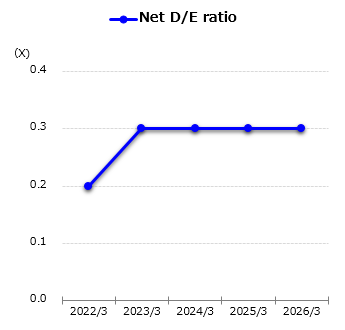
| Net D/E ratio*5 | X | 0.2 | 0.3 | 0.3 | 0.3 | 0.3 |
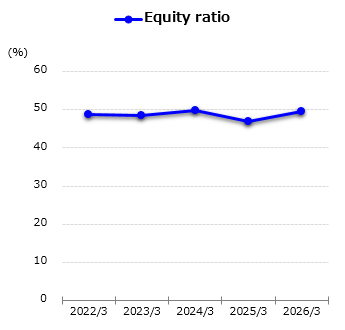
| Equity ratio | % | 48.8% | 48.4% | 49.7% | 46.9% | 49.5% |
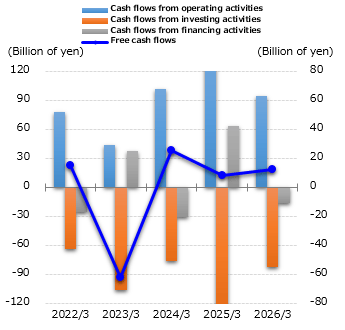
| Cash flows from operating activities | millions of yen | 78,417 | 44,093 | 101,759 | 133,672 | 94,850 |
| Cash flows from investing activities | millions of yen | -63,605 | -106,275 | -76,299 | -125,772 | -82,775 |
| Cash flows from financing activities | millions of yen | -25,547 | 37,875 | -30,208 | 63,996 | -16,133 |
| Free cash flows | millions of yen | 14,812 | -62,182 | 25,461 | 7,900 | 12,075 |
Expenditures etc
| FY3/2022 | FY3/2023*1 | FY3/2024 | FY3/2025*2 | FY3/2026*6 | ||
|---|---|---|---|---|---|---|
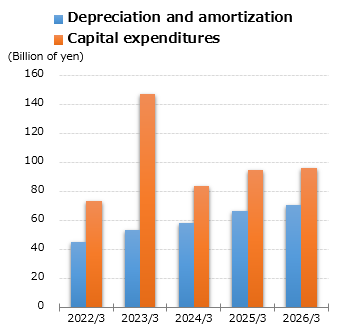
| Depreciation and amortization | millions of yen | 45,231 | 53,250 | 58,359 | 66,206 | 70,422 |
| Capital expenditures | millions of yen | 73,504 | 147,040 | 83,570 | 94,777 | 96,461 |
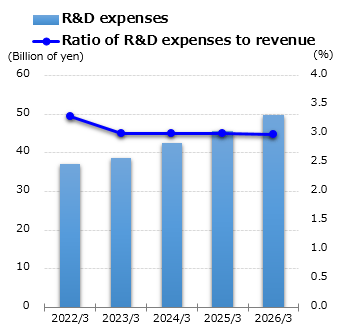
| R&D expenses | millions of yen | 37,065 | 38,754 | 42,662 | 45,529 | 49,755 |
| Ratio of R&D expenses to revenue | % | 3.3% | 3.0% | 3.0% | 3.0% | 3.0% |
- *1 We have included the following companies in the scope of consolidation;
HONDA TSUSHIN KOGYO CO., LTD. since September 16, 2022
Minebea Connect Inc. (formerly SUMIKO TEC CO., LTD.) since November 1, 2022
Minebea AccessSolutions Inc. (formerly Honda Lock Mfg. Co., Ltd.) since January 27, 2023 - *2 Minebea Power Semiconductor Device Inc. (formerly Hitachi Power Semiconductor Device, Ltd.) has been included in the scope of consolidation since May 2, 2024.
- *3 Number of outstanding shares : Total number of shares issued -Treasury stock
- *4 EBITDA : Operating income + Depreciation and amortization
- *5 Net interest-bearing debts = "Bonds and borrowings" - ("Cash and cash equivalents" + Time deposit more than 3 months)
- *6 Minebea Linear Motion Inc. (formerly TN Linear Motion Inc.) has been included in the scope of consolidation since October 3, 2025.


