


Presentation Transcripts
Latest Update : Dec.6, 2023
Back to Financial Results (FY3/2024)
Investor Meeting Presentation for 2Q FY 3/2024 held on November 2, 2023
- Cover
- Today's Agenda
- Financial Results
- Summary of Consolidated Business Results for 2Q
- Summary of Consolidated Business Results for 1H
- Net Sales, Operating Income / Margin
- 2Q Actual: Differences from the Forecast as of August
- Precision Technologies (PT)
- Motor, Lighting & Sensing (MLS)
- Semiconductors & Electronics (SE)
- Access Solutions (AS)
- Profit Attributable to Owners of the Parent / EPS
- Inventory
- Net Interest-bearing Debt / Free Cash Flow
- Forecast
- Forecast for Business Segment
- Full-year Operating Income: Differences from the Initial Forecast
- Management Policy & Business Strategy
- Summary
- Key Points of FY3/24 Forecast
- Business Acquisition of Hitachi Power Semiconductor Device, LTD.
- Expansion of the Power Semiconductor Business through the Acquisition of Hitachi Power Semiconductor Device Business (1)
- Expansion of the Power Semiconductor Business through the Acquisition of Hitachi Power Semiconductor Device Business (2)
- Access Solutions Segment (AS)
- FY3/25 Operating Income Image
- Signs of Bottoming Out
- ESG Topics (1)
- ESG Topics (2)
- Shareholders Return
- Forward-looking Statements
- Reference
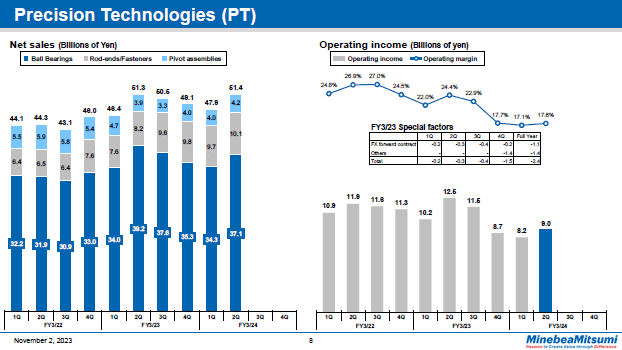
Now let's take a look at the quarterly results by segment, starting with the Precision Technologies business segment.
On the left is a graph indicating quarterly net sales trends and on the right is a graph with a bar chart quarterly operating income trends along with a line chart for operating margins.
Second quarter net sales increased 7.4% quarter on quarter to total 51.4 billion yen. Sales of ball bearings increased 8.2% quarter on quarter to total 37.1 billion yen.
The monthly external shipment volume was up 7.1% quarter on quarter for a monthly average of 200 million units. This was mainly due to an increase in automotive applications thanks to market recovery and content growth, as well as signs of slightly bottoming out in data center applications. Sales of rod-ends and fasteners, totaling 10.1 billion yen, were up 4.4% over the previous quarter. Sales of pivot assemblies up 7.3% quarter on quarter to total 4.2 billion yen.
Operating income for the quarter totaled 9.0 billion yen, and the operating margin was 17.6%.
On a quarter-on-quarter basis, operating income increased 10.1% while the operating margin improved 0.5 percentage points.
Looking at the results by product quarter on quarter, we see that operating income for ball bearings and pivot assemblies increased.
8page (total 39pages)
![]() You need Adobe Reader® to view these documents. Click on Adobe Reader icon on the left to download the software from the Adobe Systems website.
You need Adobe Reader® to view these documents. Click on Adobe Reader icon on the left to download the software from the Adobe Systems website.
It ends about main text.


