Main text is as follows.
Presentation Transcripts
Latest Update : May 28, 2014
Back to Financial Results (FY3/2014)
Investor Meeting Presentation for FY 3/2014 held on May 9, 2014
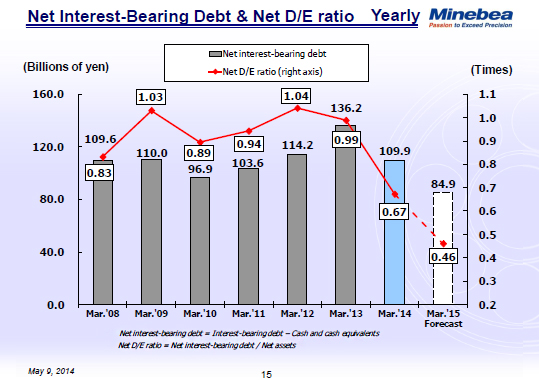
This graph shows net interest-bearing debt, which is total interest-bearing debt minus cash and cash equivalents, and net debt to equity ratio for each fiscal year.
Net interest-bearing debt fell by a whopping 26.3 billion yen to total 109.9 billion yen at the end of the fiscal year.
Thanks to the increased profit as well as the smaller negative item of foreign currency translation adjustment, net assets rose by 25.6 billion yen to reach 163.5 billion yen while net DE ratio at the end of the fiscal year dropped to 0.67.
16page (total 42pages)
 You need Adobe Reader® to view these documents. Click on Adobe Reader icon on the left to download the software from the Adobe Systems website.
It ends about main text.
menu related to this page is as follows.