


Information by Region and User Industry
Latest Update : Mar.11, 2026
* MinebeaMitsumi has adopted International Financial Reporting Standards (IFRS) from the 1Q of FY3/2019.
- Anuual
- Quarter
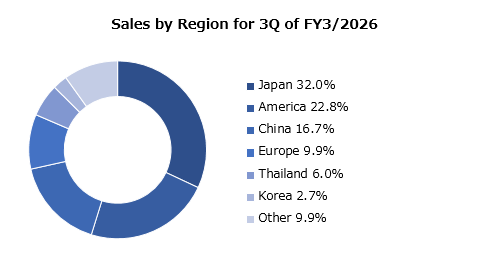
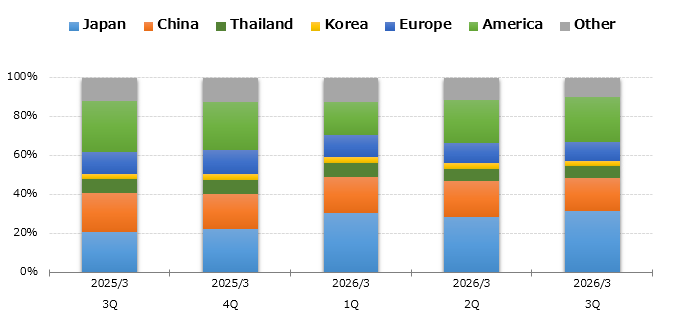
Sales by Region
| FY3/2025 3Q |
FY3/2025 4Q |
FY3/2026 1Q |
FY3/2026 2Q |
FY3/2026 3Q*1 |
||
|---|---|---|---|---|---|---|
| Japan | millions of yen | 77,676 | 84,460 | 112,028 | 118,443 | 145,173 |
| Distribution Ratio | % | 21.0% | 22.5% | 30.5% | 28.8% | 32.0% |
| China | millions of yen | 73,975 | 67,264 | 69,188 | 74,344 | 75,929 |
| Distribution Ratio | % | 20.0% | 18.0% | 18.9% | 18.1% | 16.7% |
| Thailand | millions of yen | 27,247 | 27,126 | 25,717 | 26,982 | 27,139 |
| Distribution Ratio | % | 7.4% | 7.2% | 7.0% | 6.6% | 6.0% |
| Korea | millions of yen | 9,114 | 10,345 | 10,629 | 11,844 | 12,073 |
| Distribution Ratio | % | 2.5% | 2.8% | 2.9% | 2.9% | 2.7% |
| Europe | millions of yen | 40,810 | 46,685 | 41,588 | 42,396 | 45,131 |
| Distribution Ratio | % | 11.0% | 12.5% | 11.3% | 10.3% | 9.9% |
| America | millions of yen | 96,358 | 92,343 | 61,949 | 90,510 | 103,551 |
| Distribution Ratio | % | 26.1% | 24.6% | 16.9% | 22.0% | 22.8% |
| Other | millions of yen | 44,463 | 46,600 | 45,826 | 46,870 | 44,925 |
| Distribution Ratio | % | 12.0% | 12.4% | 12.5% | 11.3% | 9.9% |
| Total | millions of yen | 369,643 | 374,823 | 366,925 | 411,389 | 453,921 |
| Distribution Ratio | % | 100.0% | 100.0% | 100.0% | 100.0% | 100.0% |
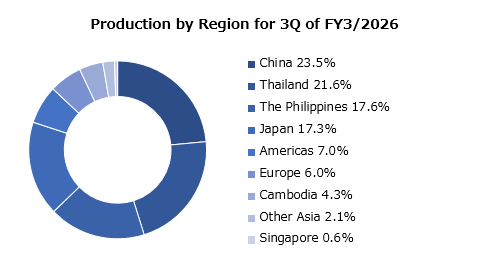
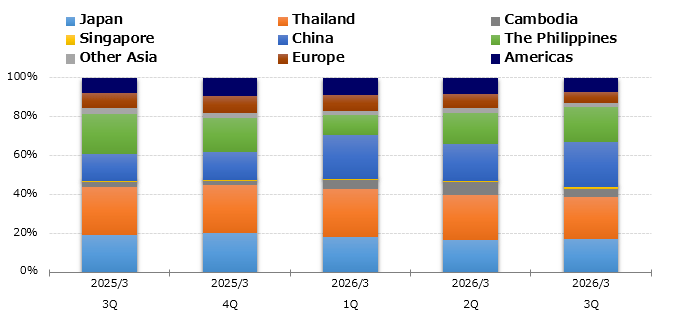
Production by Region
| FY3/2025 3Q |
FY3/2025 4Q |
FY3/2026 1Q |
FY3/2026 2Q |
FY3/2026 3Q*1 |
||
|---|---|---|---|---|---|---|
| Japan | millions of yen | 72,545 | 76,827 | 67,452 | 69,932 | 78,304 |
| Distribution Ratio | % | 19.6% | 20.5% | 18.4% | 17.0% | 17.3% |
| Thailand | millions of yen | 91,190 | 91,472 | 89,861 | 94,600 | 98,271 |
| Distribution Ratio | % | 24.7% | 24.4% | 24.5% | 23.0% | 21.6% |
| Cambodia | millions of yen | 8,596 | 8,066 | 16,776 | 26,908 | 19,602 |
| Distribution Ratio | % | 2.3% | 2.2% | 4.6% | 6.5% | 4.3% |
| Singapore | millions of yen | 2,943 | 2,262 | 2,663 | 2,624 | 2,576 |
| Distribution Ratio | % | 0.8% | 0.6% | 0.7% | 0.6% | 0.6% |
| China | millions of yen | 50,243 | 53,619 | 81,975 | 79,097 | 106,816 |
| Distribution Ratio | % | 13.6% | 14.3% | 22.3% | 19.2% | 23.5% |
| The Philippines | millions of yen | 76,356 | 65,691 | 37,864 | 65,458 | 79,897 |
| Distribution Ratio | % | 20.7% | 17.5% | 10.3% | 15.9% | 17.6% |
| Other | millions of yen | 9,820 | 9,659 | 8,905 | 9,980 | 9,628 |
| Distribution Ratio | % | 2.7% | 2.6% | 2.4% | 2.5% | 2.1% |
| Asia (excluding Japan) | millions of yen | 239,148 | 230,770 | 238,044 | 278,667 | 316,790 |
| Distribution Ratio | % | 64.7% | 61.6% | 64.9% | 67.8% | 69.8% |
| Europe | millions of yen | 28,679 | 31,680 | 28,549 | 29,354 | 27,040 |
| Distribution Ratio | % | 7.8% | 8.5% | 7.8% | 7.1% | 6.0% |
| Americas | millions of yen | 29,271 | 35,547 | 32,881 | 33,435 | 31,787 |
| Distribution Ratio | % | 7.9% | 9.5% | 9.0% | 8.1% | 7.0% |
| Total | millions of yen | 369,643 | 374,823 | 366,925 | 411,389 | 453,921 |
| Distribution Ratio | % | 100.0% | 100.0% | 100.0% | 100.0% | 100.0% |
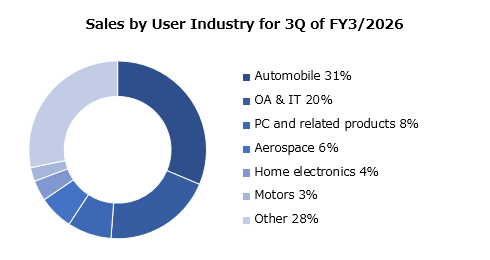
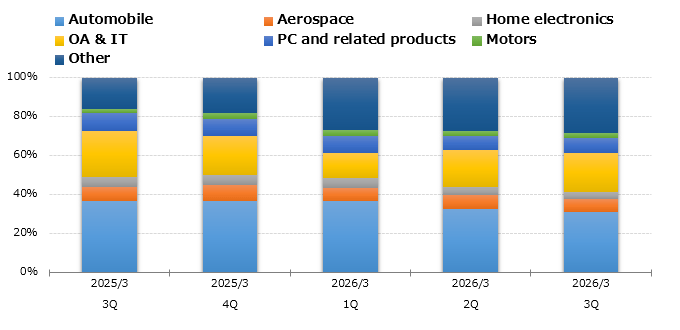
Sales by User Industry
| FY3/2025 3Q |
FY3/2025 4Q |
FY3/2026 1Q |
FY3/2026 2Q |
FY3/2026 3Q*1 |
||
|---|---|---|---|---|---|---|
| Automobile | % | 37% | 37% | 37% | 33% | 31% |
| Aerospace | % | 7% | 8% | 7% | 7% | 6% |
| Home electronics | % | 5% | 5% | 5% | 4% | 4% |
| OA & IT | % | 24% | 20% | 13% | 19% | 20% |
| PC and related products | % | 9% | 9% | 9% | 8% | 8% |
| Motors | % | 2% | 3% | 3% | 3% | 3% |
| Other | % | 16% | 18% | 27% | 27% | 28% |
| Total | % | 100% | 100% | 100% | 100% | 100% |
- *1 Minebea Linear Motion Inc. (formerly TN Linear Motion Inc.) has been included in the scope of consolidation since October 3, 2025.


