Main text is as follows.
Presentation Transcripts
Latest Update : Mar.12, 2025
Back to Financial Results (FY3/2025)
WEB Presentation for 3Q FY 3/2025 held on February 5, 2025
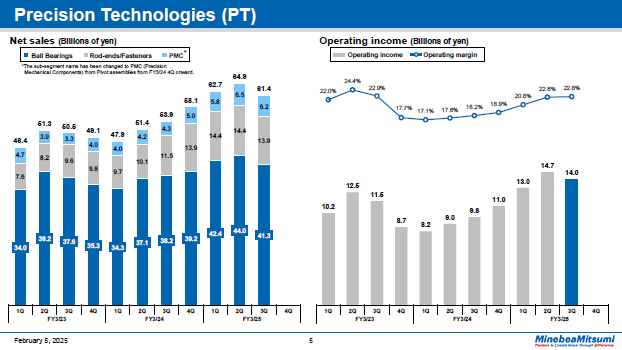
This slide shows the quarterly trends of PT segment.
On the left is a graph indicating yearly net sales trends and on the right is a graph with a bar chart showing yearly operating income trends along with a line chart for operating margins.
Third quarter net sales decreased 5.5% quarter on quarter to total 61.4 billion yen. Sales of ball bearings decreased 6.1% quarter on quarter to total 41.3 billion yen. The monthly external shipment volume was almost remained flat from the previous quarter for an average of 243 million units. This was mainly due to flat growth in automotive and data center.
Sales of rod-ends and fasteners, totaling 13.9 billion yen, down 3.4% from the previous quarter. Sales of PMC decreased 5.6% quarter on quarter to total 6.2 billion yen.
Operating income for the quarter totaled 14.0 billion yen, and the operating margin was 22.8%. On a quarter on quarter basis, operating income decreased 4.9% and the operating margin rose 0.2 percentage points.
5page (total 33pages)
 You need Adobe Reader® to view these documents. Click on Adobe Reader icon on the left to download the software from the Adobe Systems website.
It ends about main text.
menu related to this page is as follows.