Presentation Transcripts
Latest Update : Nov.25, 2015
Back to Financial Results (FY3/2016)
Investor Meeting Presentation for 2Q FY 3/2016 held on November 5, 2015
- Cover
- Table of contents
- Financial Results
- Summary of Consolidated Business Results for 1H
- Summary of Consolidated Business Results for 2Q
- Net Sales
- Operating Income
- Machined Components Business
- Electronic Devices & Components Business
- Net Income
- S.G. & A. Expenses
- Inventories
- Capital Expenditure & Depreciation
- Net Interest-Bearing Debt
- Forecast for Fiscal Year Ending March 31, 2016
- Forecast for Business Segment
- Policy and Strategy
- Table of Contents
- Current Performance and Minebea Share Price - 1
- Current Performance and Minebea Share Price - 2
- Our View on Current Market Conditions
- Our View on Future Business Risks
- 1. Efforts to keep next year's market share for LED backlights
- 2. OLED displays will not replace all high-end smartphone LCDs in 3 years
- 3-1. Profits do not decline by HDD volume down (Future of Ball Bearings and Pivot Assemblies)
- 3-2. Profits do not decline by HDD volume down (Future of HDD spindle motors)
- 4-1. Measuring Components business to become a growth driver this year, next and one after next
- 4-2. Motor business to become a growth driver this year, next and one after next
- Unforeseen Factors behind First Half Performance
- Outlook for this Fiscal Year
- New Mid-term Business Plan targets
- Future Developments (New Products)
- 1. Smart City Project in Cambodia
- 2. SALIOT™ (Smart Adjustable Light for IoT)
- 3. J3DD head-up displays
- Dividend Forecast
- M&A and Alliance Strategies
- Forward-looking Statements
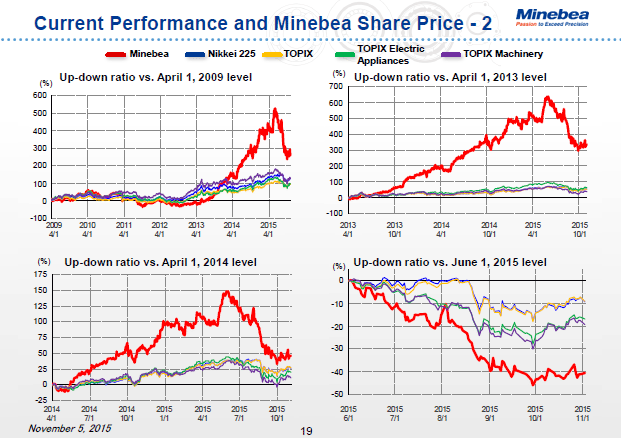
This seems to be the biggest turnout we've had since I've been CEO and I assume you're all here to mainly find out about our share price. I've been told that the CEO of an issuing company should not talk share prices, but these four graphs will help explain the contents of today's presentation. These graphs show our share prices compared against the Nikkei 225, TOPIX, TOPIX Electric Appliances, and TOPIX Machinery Indices, with the price starting at zero. The graph on the top left starts in April 2009, when I took the reins as CEO, while the graph on the top right begins in April two years ago, and the graph on the bottom left in April a year ago. When our share prices are indexed against the prices as of June 1, 2015, you unfortunately get the graph shown on the bottom right. Share prices follow the law of supply and demand so when more people are selling them, they get sold. Working against this backdrop, I think the best thing to do is show how our growth strategies have paid off. In following the table of contents I showed you earlier I hope to do just that. If you consider the fact that not even nations can boost their economies with financial and monetary policies alone, looking at our growth strategies should help put our share prices in a proper light.
20page (total 38pages)
![]() You need Adobe Reader® to view these documents. Click on Adobe Reader icon on the left to download the software from the Adobe Systems website.
You need Adobe Reader® to view these documents. Click on Adobe Reader icon on the left to download the software from the Adobe Systems website.
It ends about main text.


