Main text is as follows.
Presentation Transcripts
Latest Update : Nov.25, 2015
Back to Financial Results (FY3/2016)
Investor Meeting Presentation for 2Q FY 3/2016 held on November 5, 2015
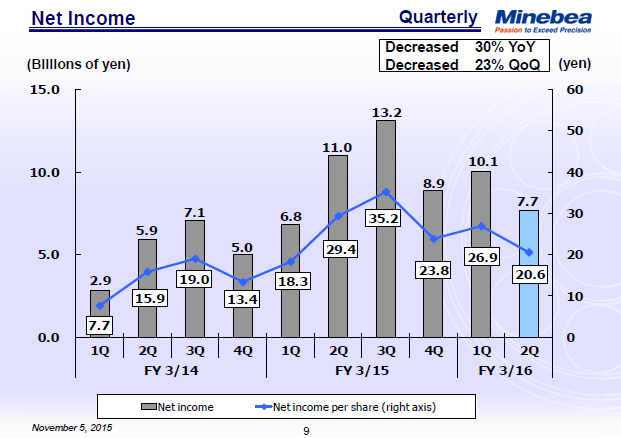
Net income for the second quarter fell 23% from the previous quarter to total 7.7 billion yen. One reason for the decline was a decrease in ordinary income due to foreign exchange losses totaling 3.9 billion yen. That figure accounts mainly for revaluation losses intended to cover foreign exchange fluctuations of the Thai baht and Chinese renminbi expected in the latter half of the fiscal year. Major extraordinary gains included a 1 billion yen Japanese government grant to one of our subsidiaries, J3DD, to boost production capacity for state-of-the-art automobile head-up display components. We used the reduction entry method to record a 0.9 billion yen extraordinary loss for machinery acquired with the government subsidy. Net income per share totaled 20.6 yen.
10page (total 38pages)
 You need Adobe Reader® to view these documents. Click on Adobe Reader icon on the left to download the software from the Adobe Systems website.
It ends about main text.
menu related to this page is as follows.