Presentation Transcripts
Latest Update : May 26, 2009
Back to Financial Results (FY3/2009)
Investor Meeting Presentation for FY 3/2009 held on May 8, 2009
- Cover
- Table of Contents
- Financial Results
- Summary of Consolidated Business Results
- Summary of Consolidated Business Results for 4Q
- Net Sales
- Operating Income
- Machined Components Business
- Electronic Devices & Components Business
- Net Income
- S.G. & A. Expenses
- Inventories
- Capital Expenditure & Depreciation
- Net Interest-Bearing Debt
- Cost Reduction Measures
- Forecast for Fiscal Year Ending March 31, 2010
- Policy and Strategy
- My Mission as CEO
- Previous Organization Chart
- Current System from Manufacturing to Delivery
- After Organizational Change: To Enhance Price Competitiveness
- Reorganize Business Portfolio
- Create New Business Model (Sales of Hybrid Components)
- New Hybrid Components Concept
- Electro Mechanics Solutions: Product examples
- Image of Expanding Hybrid Components Sales
- New Organization Chart
- Maximize Earnings Per Share
- Machined Components
- Forward-looking Statements
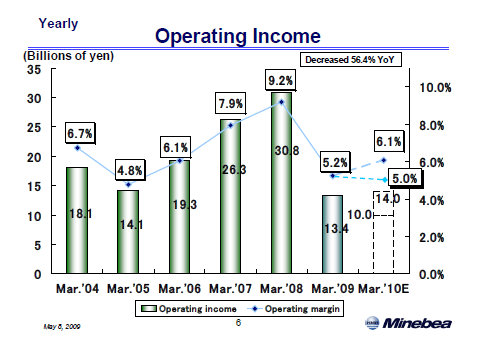
The graph shows operating income and operating margin each year.
During the first half of the last fiscal year we were affected by higher raw material prices as well as a negative impact from foreign exchange due to the strong Thai Baht against the yen since Thailand is our main production base. Although the yen regained its strength against the Baht in the second half, the global economic downturn brought a large decline in sales. As a result, operating income dropped sharply to 13.4 billion yen. This was the lowest in the 22 years since fiscal year ended September 30, 1987, except for the year when we changed the end of our fiscal year. The operating margin also fell to 5.2%. According to our estimate under certain assumptions, the impact of the foreign exchange on operating income was a year-on-year increase of about 0.4 billion yen during the fiscal year, while higher raw material prices had a negative effect of about 1.5 billion yen.
For the fiscal year ending March 31, 2010, operating income is projected between 14 billion yen and 10 billion yen due to the slow recovery in sales, although we expect lower raw material prices as well as positive results from efforts to reduce fixed costs and other expenses.
7page (total 44pages)
![]() You need Adobe Reader® to view these documents. Click on Adobe Reader icon on the left to download the software from the Adobe Systems website.
You need Adobe Reader® to view these documents. Click on Adobe Reader icon on the left to download the software from the Adobe Systems website.
It ends about main text.


