


Information by Business Segment
Latest Update : June 16, 2026
* MinebeaMitsumi has adopted International Financial Reporting Standards (IFRS) from the 1Q of FY3/2019.
- Anuual
- Quarter
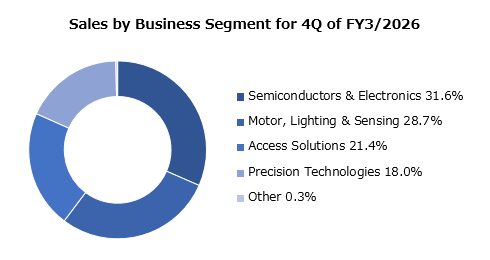
Information by Business Segment
| FY3/2025 4Q |
FY3/2026 1Q |
FY3/2026 2Q |
FY3/2026 3Q*1 |
FY3/2026 4Q |
||
|---|---|---|---|---|---|---|
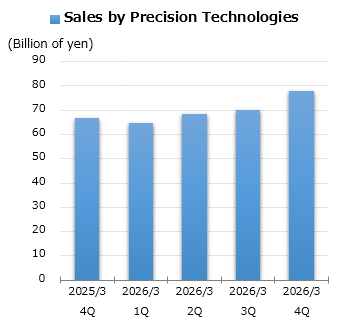
| Precision Technologies | millions of yen | 66,782 | 64,815 | 68,412 | 70,091 | 77,833 |
| Distribution Ratio | % | 17.8% | 17.7% | 16.6% | 15.4% | 18.0% |
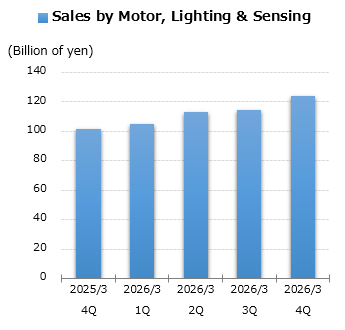
| Motor, Lighting & Sensing | millions of yen | 101,258 | 105,133 | 113,122 | 114,204 | 124,058 |
| Distribution Ratio | % | 27.0% | 28.7% | 27.5% | 25.2% | 28.7% |
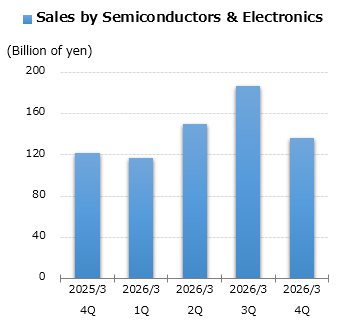
| Semiconductors & Electronics | millions of yen | 121,584 | 117,210 | 150,040 | 186,653 | 136,360 |
| Distribution Ratio | % | 32.4% | 31.9% | 36.5% | 41.1% | 31.6% |
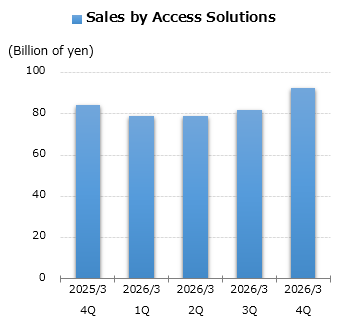
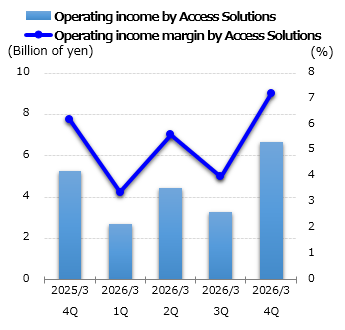
| Access Solutions | millions of yen | 84,377 | 78,899 | 78,868 | 81,972 | 92,510 |
| Distribution Ratio | % | 22.5% | 21.5% | 19.2% | 18.1% | 21.4% |
| Other | millions of yen | 822 | 868 | 947 | 1,001 | 1,391 |
| Distribution Ratio | % | 0.2% | 0.2% | 0.2% | 0.2% | 0.3% |
| Net sales | millions of yen | 374,823 | 366,925 | 411,389 | 453,921 | 432,152 |
| Distribution Ratio | % | 100.0% | 100.0% | 100.0% | 100.0% | 100.0% |
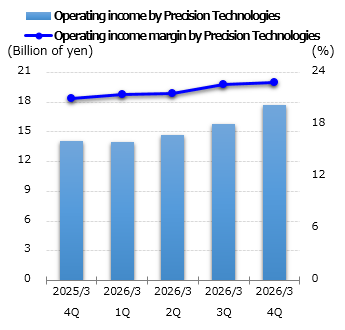
| Precision Technologies | millions of yen | 14,036 | 13,951 | 14,734 | 15,816 | 17,744 |
| Operating income margin | % | 21.0% | 21.5% | 21.5% | 22.6% | 22.8% |
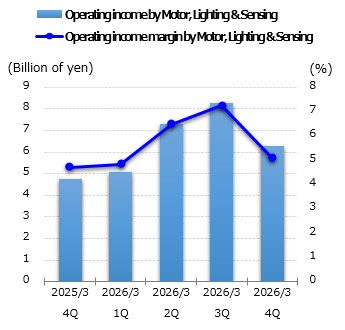
| Motor, Lighting & Sensing | millions of yen | 4,760 | 5,085 | 7,307 | 8,259 | 6,278 |
| Operating income margin | % | 4.7% | 4.8% | 6.5% | 7.2% | 5.1% |
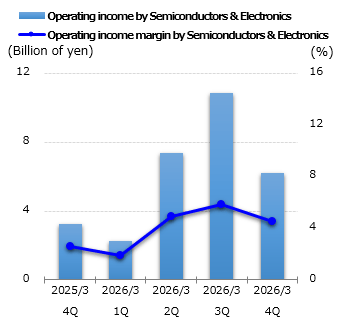
| Semiconductors & Electronics | millions of yen | 3,218 | 2,250 | 7,395 | 10,840 | 6,184 |
| Operating income margin | % | 2.6% | 1.9% | 4.9% | 5.8% | 4.5% |
| Access Solutions | millions of yen | 5,256 | 2,712 | 4,434 | 3,270 | 6,671 |
| Operating income margin | % | 6.2% | 3.4% | 5.6% | 4.0% | 7.2% |
| Other | millions of yen | -295 | -451 | -429 | -482 | -1,295 |
| Adjustments | millions of yen | -5,444 | -6,115 | -6,486 | -6,414 | -7,279 |
| Operating income | millions of yen | 21,531 | 17,432 | 26,955 | 31,289 | 28,303 |
| Operating income margin | % | 5.7% | 4.8% | 6.6% | 6.9% | 6.5% |
- *1 Minebea Linear Motion Inc. (formerly TN Linear Motion Inc.) has been included in the scope of consolidation since October 3, 2025.


