


Information by Business Segment
Latest Update : June 16, 2026
* MinebeaMitsumi has adopted International Financial Reporting Standards (IFRS) from the 1Q of FY3/2019.
- Anuual
- Quarter
Information by Business Segment
| FY3/2022*1 | FY3/2023*2 | FY3/2024 | FY3/2025*3 | FY3/2026*4 | ||
|---|---|---|---|---|---|---|
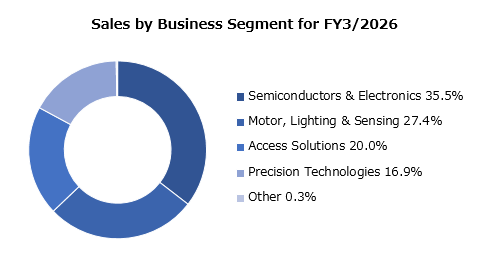
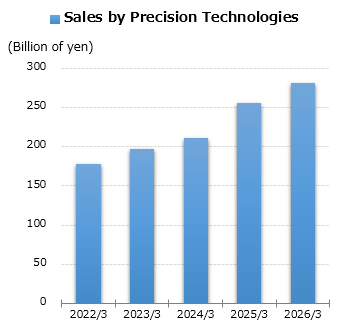
| Precision Technologies | millions of yen | 177,470 | 197,300 | 211,406 | 255,702 | 281,151 |
| Distribution Ratio | % | 15.8% | 15.3% | 15.1% | 16.8% | 16.9% |
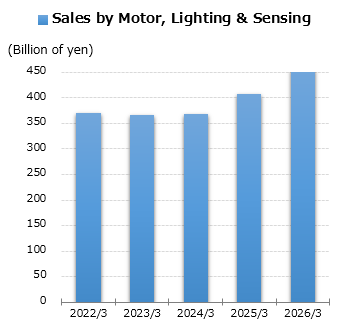
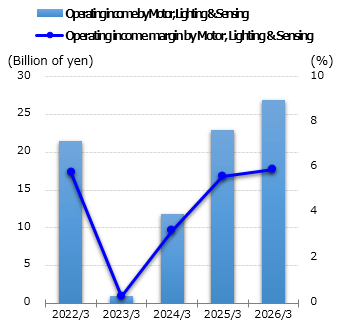
| Motor, Lighting & Sensing | millions of yen | 371,023 | 366,275 | 369,388 | 407,743 | 456,517 |
| Distribution Ratio | % | 33.0% | 28.2% | 26.3% | 26.8% | 27.4% |
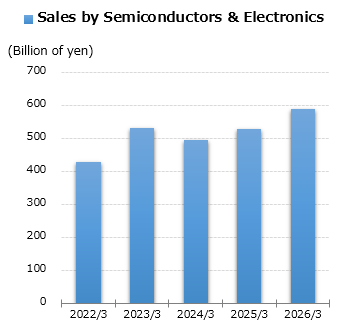
| Semiconductors & Electronics | millions of yen | 429,116 | 530,079 | 494,717 | 527,646 | 590,263 |
| Distribution Ratio | % | 38.2% | 41.0% | 35.3% | 34.7% | 35.5% |
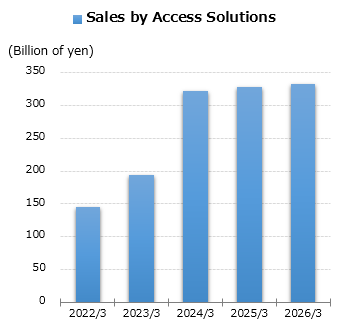
| Access Solutions | millions of yen | 145,577 | 194,699 | 322,108 | 328,081 | 332,249 |
| Distribution Ratio | % | 12.9% | 15.1% | 23.0% | 21.5% | 20.0% |
| Other | millions of yen | 954 | 3,850 | 4,508 | 3,531 | 4,207 |
| Distribution Ratio | % | 0.1% | 0.3% | 0.3% | 0.2% | 0.3% |
| Net sales | millions of yen | 1,124,140 | 1,292,203 | 1,402,127 | 1,522,703 | 1,664,387 |
| Distribution Ratio | % | 100.0% | 100.0% | 100.0% | 100.0% | 100.0% |
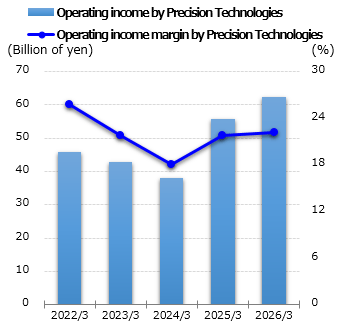
| Precision Technologies | millions of yen | 45,717 | 42,951 | 38,035 | 55,696 | 62,245 |
| Operating income margin | % | 25.8% | 21.8% | 18.0% | 21.8% | 22.1% |
| Motor, Lighting & Sensing | millions of yen | 21,561 | 922 | 11,867 | 22,984 | 26,929 |
| Operating income margin | % | 5.8% | 0.3% | 3.2% | 5.6% | 5.9% |
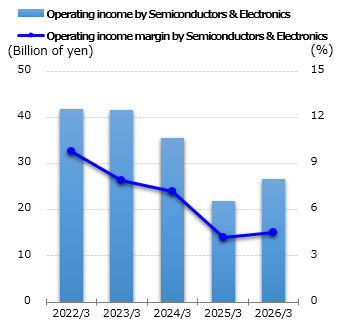
| Semiconductors & Electronics | millions of yen | 41,846 | 41,644 | 35,522 | 22,003 | 26,669 |
| Operating income margin | % | 9.8% | 7.9% | 7.2% | 4.2% | 4.5% |
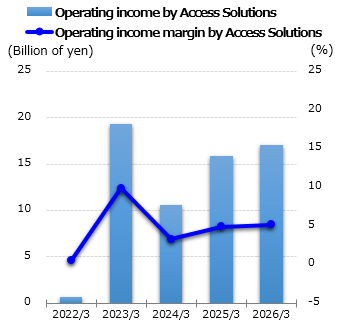
| Access Solutions | millions of yen | 732 | 19,361 | 10,625 | 15,924 | 17,087 |
| Operating income margin | % | 0.5% | 9.9% | 3.3% | 4.9% | 5.1% |
| Other | millions of yen | -1,429 | -48 | -728 | -1,194 | -2,657 |
| Adjustments | millions of yen | -16,291 | -7,300 | -21,785 | -20,931 | -26,294 |
| Operating income | millions of yen | 92,136 | 97,530 | 73,536 | 94,482 | 103,979 |
| Operating income margin | % | 8.2% | 7.5% | 5.2% | 6.2% | 6.2% |
- *1 We have changed our business segment classification for some businesses since FY3/2022. For your reference, figures of FY3/2021 are presented based on the classification before the change.
- *2 As a result of the change in the corporate organization, some classification in "Other" and "Adjustments" have changed from the first quarter of FY3/2023. For your reference, figures of FY3/2022 are presented based on the classification before the change.
We have included the following companies in the scope of consolidation;
HONDA TSUSHIN KOGYO CO., LTD. since September 16, 2022
Minebea Connect Inc. (formerly SUMIKO TEC CO., LTD.) since November 1, 2022
Minebea AccessSolutions Inc. (formerly Honda Lock Mfg. Co., Ltd.) since January 27, 2023 - *3 Minebea Power Semiconductor Device Inc. (formerly Hitachi Power Semiconductor Device, Ltd.) has been included in the scope of consolidation since May 2, 2024.
- *4 Minebea Linear Motion Inc. (formerly TN Linear Motion Inc.) has been included in the scope of consolidation since October 3, 2025.


