


Information by Region and User Industry
Latest Update : June 16, 2026
* MinebeaMitsumi has adopted International Financial Reporting Standards (IFRS) from the 1Q of FY3/2019.
- Anuual
- Quarter
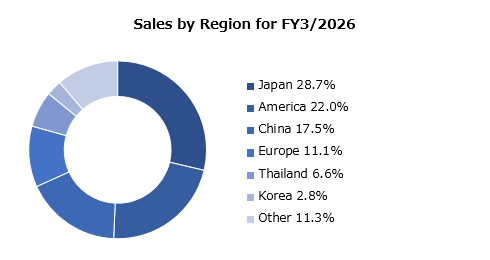
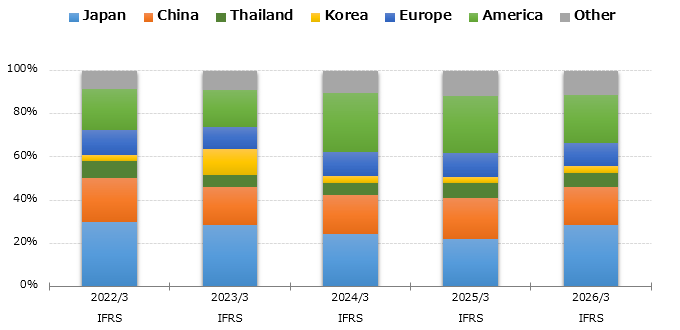
Sales by Region
| FY3/2022 | FY3/2023*1 | FY3/2024 | FY3/2025*2 | FY3/2026*3 | ||
|---|---|---|---|---|---|---|
| Japan | millions of yen | 334,076 | 367,067 | 341,814 | 336,859 | 477,880 |
| Distribution Ratio | % | 29.7% | 28.4% | 24.4% | 22.1% | 28.7% |
| China | millions of yen | 233,051 | 225,878 | 249,021 | 287,388 | 291,354 |
| Distribution Ratio | % | 20.7% | 17.5% | 17.8% | 18.9% | 17.5% |
| Thailand | millions of yen | 86,487 | 76,009 | 82,670 | 106,237 | 109,261 |
| Distribution Ratio | % | 7.7% | 5.9% | 5.9% | 7.0% | 6.6% |
| Korea | millions of yen | 29,427 | 150,755 | 40,669 | 39,399 | 46,949 |
| Distribution Ratio | % | 2.6% | 11.7% | 2.9% | 2.6% | 2.8% |
| Europe | millions of yen | 134,484 | 137,320 | 158,320 | 171,948 | 184,399 |
| Distribution Ratio | % | 12.0% | 10.6% | 11.3% | 11.3% | 11.1% |
| America | millions of yen | 210,765 | 216,938 | 380,702 | 398,905 | 366,276 |
| Distribution Ratio | % | 18.7% | 16.8% | 27.2% | 26.2% | 22.0% |
| Other | millions of yen | 95,850 | 118,236 | 148,931 | 181,967 | 188,268 |
| Distribution Ratio | % | 8.6% | 9.1% | 10.5% | 11.9% | 11.3% |
| Total | millions of yen | 1,124,140 | 1,292,203 | 1,402,127 | 1,522,703 | 1,664,387 |
| Distribution Ratio | % | 100.0% | 100.0% | 100.0% | 100.0% | 100.0% |
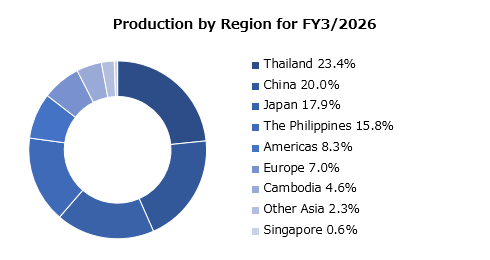
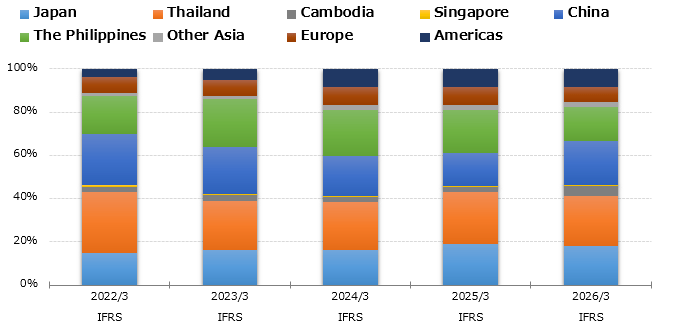
Sales Composition by Production Site
| FY3/2022 | FY3/2023*1 | FY3/2024 | FY3/2025*2 | FY3/2026*3 | ||
|---|---|---|---|---|---|---|
| Japan | millions of yen | 170,122 | 210,950 | 228,895 | 292,143 | 298,656 |
| Distribution Ratio | % | 15.1% | 16.3% | 16.3% | 19.2% | 17.9% |
| Thailand | millions of yen | 317,399 | 291,645 | 310,171 | 363,355 | 389,398 |
| Distribution Ratio | % | 28.2% | 22.6% | 22.1% | 23.9% | 23.4% |
| Cambodia | millions of yen | 25,176 | 35,256 | 34,408 | 34,576 | 76,256 |
| Distribution Ratio | % | 2.2% | 2.7% | 2.5% | 2.3% | 4.6% |
| Singapore | millions of yen | 8,572 | 8,505 | 6,378 | 9,234 | 10,109 |
| Distribution Ratio | % | 0.8% | 0.7% | 0.5% | 0.6% | 0.6% |
| China | millions of yen | 265,661 | 277,018 | 258,004 | 229,750 | 332,929 |
| Distribution Ratio | % | 23.6% | 21.4% | 18.4% | 15.1% | 20.0% |
| The Philippines | millions of yen | 200,135 | 291,832 | 297,595 | 304,671 | 262,748 |
| Distribution Ratio | % | 17.8% | 22.6% | 21.2% | 20.0% | 15.8% |
| Other | millions of yen | 12,784 | 14,054 | 34,775 | 37,800 | 38,734 |
| Distribution Ratio | % | 1.2% | 1.1% | 2.5% | 2.5% | 2.3% |
| Asia (excluding Japan) | millions of yen | 829,727 | 918,309 | 941,331 | 979,385 | 1,110,174 |
| Distribution Ratio | % | 73.8% | 71.1% | 67.1% | 64.3% | 66.7% |
| Europe | millions of yen | 81,561 | 99,320 | 117,450 | 120,383 | 116,909 |
| Distribution Ratio | % | 7.3% | 7.7% | 8.4% | 7.9% | 7.0% |
| Americas | millions of yen | 42,729 | 63,623 | 114,451 | 130,792 | 138,648 |
| Distribution Ratio | % | 3.8% | 4.9% | 8.2% | 8.6% | 8.3% |
| Total | millions of yen | 1,124,140 | 1,292,203 | 1,402,127 | 1,522,703 | 1,664,387 |
| Distribution Ratio | % | 100.0% | 100.0% | 100.0% | 100.0% | 100.0% |
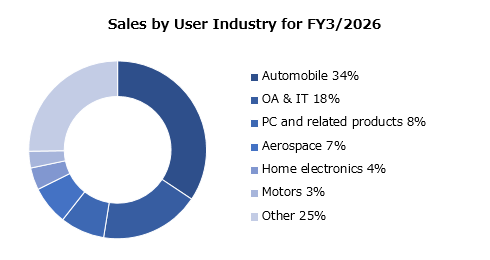
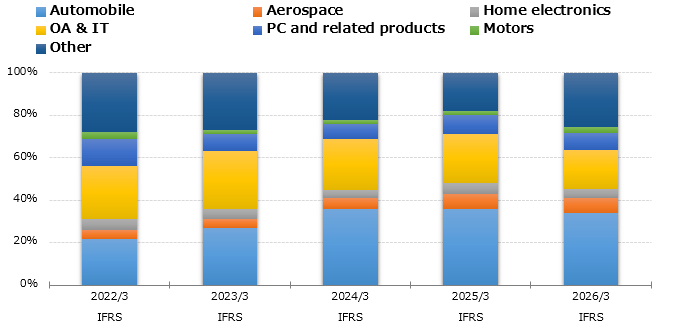
Sales by User Industry
| FY3/2022 | FY3/2023*1 | FY3/2024 | FY3/2025*2 | FY3/2026*3 | ||
|---|---|---|---|---|---|---|
| Automobile | % | 22% | 27% | 36% | 36% | 34% |
| Aerospace | % | 4% | 4% | 5% | 7% | 7% |
| Home electronics | % | 5% | 5% | 4% | 5% | 4% |
| OA & IT | % | 25% | 27% | 24% | 23% | 18% |
| PC and related products | % | 13% | 8% | 7% | 9% | 8% |
| Motors | % | 3% | 2% | 2% | 2% | 3% |
| Other | % | 28% | 27% | 22% | 18% | 25% |
| Total | % | 100% | 100% | 100% | 100% | 100% |
- *1 We have included the following companies in the scope of consolidation;
HONDA TSUSHIN KOGYO CO., LTD. since September 16, 2022
Minebea Connect Inc. (formerly SUMIKO TEC CO., LTD.) since November 1, 2022
Minebea AccessSolutions Inc. (formerly Honda Lock Mfg. Co., Ltd.) since January 27, 2023 - *2 Minebea Power Semiconductor Device Inc. (formerly Hitachi Power Semiconductor Device, Ltd.) has been included in the scope of consolidation since May 2, 2024.
- *3 Minebea Linear Motion Inc. (formerly TN Linear Motion Inc.) has been included in the scope of consolidation since October 3, 2025.


