


Presentation Transcripts
Latest Update : May 27, 2020
Back to Financial Results (FY3/2020)
Investor Meeting Presentation for FY 3/2020 held on May 8, 2020
- Cover
- Today's Agenda
- Financial Results
- Summary of Consolidated Business Results
- Summary of Consolidated Business Results for 4Q
- Net Sales, Operating Income/margin Yearly
- Net Sales, Operating Income/margin Quarterly
- 4Q Actual: Differences from the Forecast as of February
- Machined Components Yearly
- Machined Components Quarterly
- Electronic Devices & Components Yearly
- Electronic Devices & Components Quarterly
- Mitsumi Business Yearly
- Mitsumi Business Quarterly
- U-Shin Business Yearly
- U-Shin Business Quarterly
- Profit attributable to owners of the parent / EPS Yearly
- Profit attributable to owners of the parent / EPS Quarterly
- Inventory
- Net interest-bearing debt / Free cash flow
- Forecast for Fiscal Year Ending March 31, 2021
- Forecast for Business Segment
- Management Policy & Business Strategy
- Summary of FY3/20 "Net Sales Hit Record Highs"
- Key Points of FY3/21 Plan
- Image of Operating Income for FY3/21
- OP Rank within Electronic Component Sector
- Impact from the Novel Coronavirus
- Mid-term Business Plan Targets
- Machined Components Targets
- Electronic Devices and Components Targets
- Mitsumi Business Targets
- U-Shin Business Targets
- Acquisition of All Shares of ABLIC Inc.
- Focused Development Field
- Building the Strongest Domestic Association
- Ranking Changed in Eight Spears Strategy
- Our Response to the Novel Coronavirus
- Use of FCF and Shareholder Returns
- Dividend Forecast
- Forward-looking Statements
- Reference
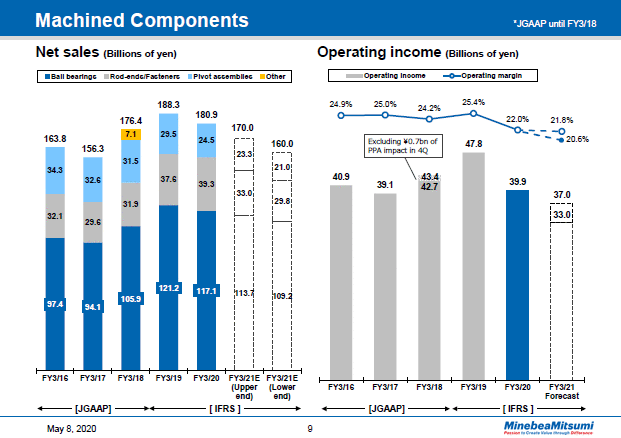
Now let's take a look at the results by segment, starting with machined components business segment.
On the left is a graph indicating yearly net sales trends and on the right is a graph with a bar chart showing yearly operating income trends along with a line chart for operating margins.
In the fiscal year ended March 31, 2020, net sales were down 4.0% year on year to total 180.9 billion yen.
Sales of ball bearings decreased 3.4% year on year to reach 117.1 billion yen. The monthly average bearing sales volume totaled 189 million units for a decrease of 3.6% year on year. Looking at sales by application, we see that annual sales of ball bearings used in data centers declined year on year but sales were clearly up in the third quarter and onward. On the other hand, sales of ball bearings for automobile applications gradually slowed in the latter half of the fourth quarter although overall sales were up year on year for the fiscal year.
Sales of rod-ends and fasteners were up 4.4% year on year to total 39.3 billion yen.
Sales of pivot assemblies decreased 17.0% year on year to total 24.5 billion yen. While we were impacted by market factors such as the novel coronavirus, pivot assemblies steadily contributed to our bottom line as we held on to an 80% plus market share.
Operating income for the fiscal year ended March 31, 2020 totaled 39.9 billion yen, putting the operating margin at 22.0%. We saw operating income decrease 16.5% and the operating income margin decline 3.4 percentage points year on year. Looking at the year-on-year results by product, we see that profits for rod-ends and fasteners rose while profits for ball bearings and pivot assemblies fell.
For the fiscal year ending March 31, 2021, we can see clear uptrend in demand for ball bearings used in servers. Sales for commercial aircraft will be affected by customer production adjustment. Sales for automobile applications is expected to recover gradually although they will be affected by demand decline in the first half of the fiscal year.
Rod-ends and fasteners are expected to be affected by production adjustments for commercial aircraft. For pivot assembly, we anticipate a decline in demand as the HDD market shrinks.
9page (total 45pages)
![]() You need Adobe Reader® to view these documents. Click on Adobe Reader icon on the left to download the software from the Adobe Systems website.
You need Adobe Reader® to view these documents. Click on Adobe Reader icon on the left to download the software from the Adobe Systems website.
It ends about main text.


