


Presentation Transcripts
Latest Update : May 23, 2019
Back to Financial Results (FY3/2019)
Investor Meeting Presentation for FY 3/2019 held on May 8, 2019
Table of Contents
- Cover
- Today's Agenda
- Financial Results
- Summary of Consolidated Business Results
- Summary of Consolidated Business Results for 4Q
- Net Sales, Operating Income/Margin -1
- Net Sales, Operating Income/Margin -2
- 4Q Actual: Differences from the Forecast as of Feb.
- Actual: Differences from the Forecast as of May '18
- Machined Components -1
- Machined Components -2
- Electronic Devices & Components -1
- Electronic Devices & Components -2
- Mitsumi Business -1
- Mitsumi Business -2
- Profit Attributable to Owners of the Parent -1
- Profit Attributable to Owners of the Parent -2
- Inventories
- Net Interest-Bearing Debt/Free Cash Flow
- Forecast for Fiscal Year Ending March 31, 2020
- Forecast for Business Segment
- Shareholders Return
- ROIC (Return On Invested Capital)
- Management Policy & Business Strategy
- Summary of Fiscal Year ended 3/19
- Summary of Fiscal Year ending 3/20
- Mid-term Business Plan Targets
- Machined Components Targets
- Electronic Devices and Components Targets
- Mitsumi Business Targets
- U-Shin Business Targets
- Mid-term Business Plan: Targets by Segment
- Basic scheme of U-Shin
- Example of synergy in U-Shin (Automobile)
- Example of synergy in U-Shin (Smart house)
- New Product Trio and Key Entry Area
- Usage of FCF and Shareholder Returns
- Dividend Forecast
- Share Buyback
- The Last Decade and the Next Decade (Image)
- Sales Transition
- OP Transition
- Major KPIs over the Last Ten Years
- Review of the Last Decade
- Macro transition
- Summary of the last decade
- Basic Strategy for the Next Decade -1
- Basic Strategy for the Next Decade -2
- Basic Strategy
- Business Strategy
- Sustainability
- Next decade by major markets
- Ball bearings next decade
- Motors next decade
- Automobile components next decade
- Aircraft components next decade
- Why MinebeaMitsumi Exceeds Market Growth
- (Reference) Aircraft components
- Home Appliance / OA / HDD next decade
- Medical components next decade
- Home equipment business next decade
- Cultivate New Markets with IoT and AI/Big Data
- Large Portfolio Shift to Core Businesses
- EBITDA/Net interest-bearing debts/Free cash flows
- Capital Deployment
- (Reference) Past and Future of Free Cash Flow
- KPI target
- Forward-looking Statements
- Reference
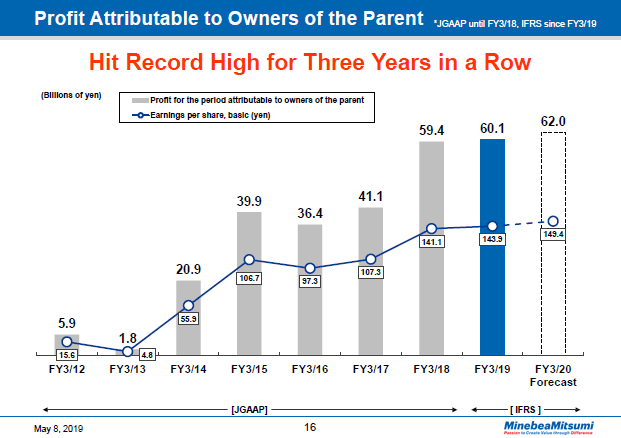
The bar graph here shows trends in profit attributable to owners of the parent while the line graph charts changes in the profit for the period per share.
The profit for the period hit a record-high 60.1 billion yen. Profit for the period per share was 143.9 yen.
16page (total 76pages)
![]() You need Adobe Reader® to view these documents. Click on Adobe Reader icon on the left to download the software from the Adobe Systems website.
You need Adobe Reader® to view these documents. Click on Adobe Reader icon on the left to download the software from the Adobe Systems website.
It ends about main text.


