


Presentation Transcripts
Latest Update : June 5, 2017
Back to Financial Results (FY3/2017)
Investor Meeting Presentation for FY 3/2017 held on May 9, 2017
- Cover
- Table of contents
- Financial Results
- Summary of Consolidated Business Results
- Summary of Consolidated Business Results for 4Q
- Net Sales (Yearly)
- Net Sales (Quarterly)
- Operating Income
- Machined Components (Yearly)
- Machined Components (Quarterly)
- Electronic Devices & Components (Yearly)
- Electronic Devices & Components (Quarterly)
- Mitsumi Business (consolidated portion in 4Q) (Quarterly)
- Mitsumi Business (including pre-merger) (Quarterly)
- Mitsumi Business (including pre-merger) (Yearly)
- Net Income (Yearly)
- Net Income (Quarterly)
- S.G. & A. Expenses
- Inventories
- Capital Expenditure & Depreciation
- Net Interest-Bearing Debt/Free Cash Flow
- Forecast for Fiscal Year Ending March 31, 2018
- Forecast for Business Segment
- Management Policy & Business Strategy
- Full-year forecast (FY3/2018)
- Challenge to ¥1 trillion sales and/or ¥100 billion OP
- New Mid-term Business Plan targets
- Estimated breakdown of ¥100 billion OP in FY3/2021
- Machined Components plan targets
- Ball bearing strategy
- Growth of miniature ball bearings for automobiles
- Aircraft component strategy
- Pivot assembly strategy (HDD)
- Electronic Devices & Components plan targets
- LED backlight strategy - 1
- LED backlight strategy - 2
- LED backlight strategy - 3
- Motor strategy
- Sensing device strategy (Minebea business)
- Mitsumi business plan targets
- Reviewing product portfolio - 1
- Reviewing product portfolio - 2
- Seven Spears of MinebeaMitsumi
- Seven spears - 3 Sensors
- Seven spears - 4 Connectors / Switches
- Seven spears - 5 Power supplies
- Seven spears - 6 Wireless / Telecommunications / Software
- Seven spears - 7 Analog semiconductors
- Basic policy of sub-core businesses
- Developing strategic new products by fusion with Mitsumi's technology/products
- Re-enter haptic device business
- Development of haptic module
- Development of IoT-related products
- Financial strategy
- Cash flow, debt, cap-ex and D&A plan
- M&A strategy
- Forward-looking Statements
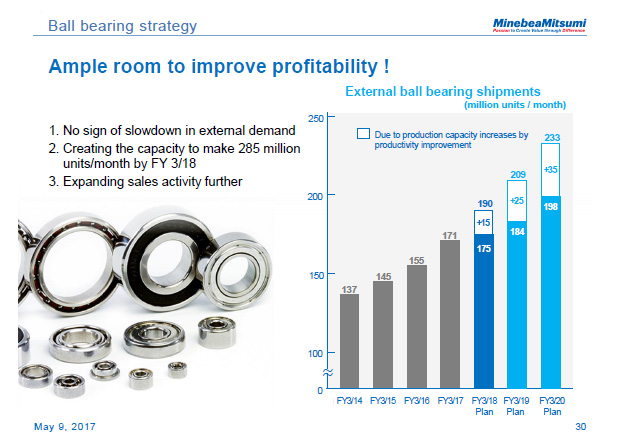
While we had expected external ball bearing sales for the fiscal year ending March 2018 to total 175 million units, we can add the amount shown in the area outlined on the bar graph with the dotted line by improving productivity. Demand has been very high, and our external sales volume grew substantially to total 180 million units in March and 177 million units in April. The March production volume hit an all-time high with 264 million units, even though productivity hadn't been improved yet. Better worker morale has made a big difference, just as it did for the Mitsumi business. We can build on this success to make even more. You may be wondering if we can really sell all those extra ball bearings. We are currently looking into strategies for expanding sales by selling them at special prices because we can practically make them at the cost of the raw materials. At any rate, please note that the areas outlined by a dotted line on the graph indicate additional units that are not included in the plan.
30page (total 57pages)
![]() You need Adobe Reader® to view these documents. Click on Adobe Reader icon on the left to download the software from the Adobe Systems website.
You need Adobe Reader® to view these documents. Click on Adobe Reader icon on the left to download the software from the Adobe Systems website.
It ends about main text.


