ESG related Information
Disclosures based on TCFD recommendations
Governance
We approach the risks and opportunities associated with climate change based on our Climate Change-related Risk Management Regulations. These regulations determine our internal systems for managing climate change risks and opportunities, as well as our processes for managing risk and opportunities using plan-do-check-act (PDCA) cycles.
Chairman CEO has ultimate responsibility for managing our climate change risks and opportunities. Chairman CEO manages these risks and opportunities by utilizing the Risk Management Committee, which is responsible for all risks, and the Environmental Management Committee, which is responsible for environmental management, including climate change-related risks and opportunities. This enables Chairman CEO to evaluate and monitor progress on response measures and goals. The Carbon Neutral Steering Committee, which reports directly to Chairman CEO, performs internal arrangements, and makes proposals regarding policies and basic measures for carbon neutrality.
At meetings of the Senior Executive Officer Council, Chairman CEO evaluates the effectiveness of the Company's governance related to climate change. The Board of Directors performs monitoring and supervision to ensure Company executives, including Chairman CEO, are responding appropriately to climate change risks and opportunities.
The officer in charge of sustainability manages the Company's climate change response progress as one of the sustainability issues.
Internal structure for managing the risks and opportunities related to climate change
| Body / Meeting Frequency | Role | Chairperson | Members |
|---|---|---|---|
| Board of Directors (once a month in principle) | The Board of Directors performs monitoring and oversight to ensure that the President and other executive officers are responding appropriately to climate change risks and opportunities. | Representative Director, Chairman CEO |
|
| Senior Executive Officer Council (once a month in principle) | The Senior Executive Officer Council supervises management's approach to risk owners related to climate change and governance and challenges it as necessary. It is also responsible for checking the program for effectively identifying, assessing, managing, and supervising risks and opportunities related to climate change. | Representative Director, Chairman CEO |
|
| Carbon Neutral Steering Committee (approximately twice a year) |
The CNSC promotes measures to reduce power consumption in factories as well as power consumption by users of the Company's products. | Chief Green Officer (CGO) |
|
| Risk Management Committee (twice a year) |
The Risk Management Committee promotes company-wide risk management to achieve business targets and mount a company-wide response to factor impeding business management. It also coordinates with the Environmental Management Committee on risks and opportunities related to climate change to promote integrated management. | Head of HR & General Affairs Div. |
|
| Environmental Management Committee (twice a year) |
Reports to the Risk Management Committee and the Board of Directors on the results of assessment and reassessment of climate change risks and opportunities, as well as the results of analysis of their impact on business strength. This includes the evaluation and oversight of target progress and the status of response plan implementation. | Chief Green Officer (CGO) |
|
Risk Management
Management Process
Our process for climate change risk and opportunity management is shown in the diagram below. This plan-do-check-act (PDCA) cycle is implemented company-wide every fiscal year.
The risk assessment covers not only our direct operations, but also upstream and downstream operations in the value chain. This includes raw material procurement, logistics, customer and end user activities.
The management process includes deliberation by the Environmental Management Committee, which consists of managers from each business unit. The results of those deliberations are checked by the Senior Executive Officer Council and the Board of Directors. Specifically, through daily information gathering activities using our monitoring system, we strive to anticipate risks as much as possible, and estimate the potential damage in the event of a crisis (damage estimation). We then implement measures for minimizing these risks including preventive and mitigation measures. In the event of a crisis, we are able to transition to an emergency response led by the Risk Management Committee in order to minimize losses.
Identification method
Risks and opportunities are identified using the following system.
Evaluation method
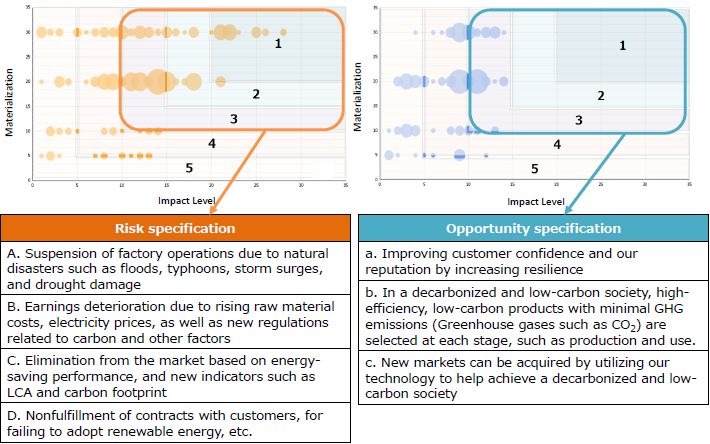
We quantify the identified risks and opportunities using the following evaluation method.
-Degree of impact: Calculating the total of quantitative and qualitative impacts (1 to 30 points)
-Likelihood of occurrence: Rated on a four-level scale, ranging from "Extremely likely" to "Unlikely" (5 to 30 points)
After quantification through the above process, the distribution is as follows. We ranked the risks and opportunities within the following framework from highest (1) to lowest (5).
Period setting
While specifying climate change risks and opportunities, we consider the following short, medium, and long-term perspectives.
Response plan
We have specified climate change risks and opportunities and have created a response plan for the fiscal year ended March 31, 2025. The plan was devised based on the approach that risk response creates opportunities, and that risks and opportunities are two sides of the same coin.
This response plan for the fiscal year ended March 31, 2025, has been incorporated into the business plans for the same year adopted by each of our business units and factories. After thorough plan implementation, the results will be compiled.
Figure 1: Response plan and result for the fiscal year ended March 2025
| Item | Risks | Opportunities | '25/3 Plan | '25/3 Result |
|---|---|---|---|---|
| Response to water risks | Suspension of plant operations due to flooding, typhoon, flood tides, drought, etc. | Secure the trust of our customers by enhancing resilience |
|
|
| Improving productivity and efficient use of resources and energy, including transportation | Deterioration in earnings due to soaring prices of raw materials and power, carbon tax, etc. | Improving profits through energy-saving, decarbonized, resource-saving, production activities |
<Production efficiency>
|
|
| Improving product performance and providing new products | Market selection driven by new markets such as energy efficiency performance, LCA, and CFP | Capture market share by providing energy-saving, low-carbon, resource-saving products |
<Product performance>
|
|
| Responding to customer/country requests | Loss of business due to failure to fulfill customer requests such as introducing renewable energy, reducing our carbon footprint, etc. | Secure orders by earnestly fulfilling customer demands aimed decarbonization |
|
Responding to customer requests
|
| Curbing PFC and SF6 emissions | Increase investment due to the introduction of regulations on highly greenhouse PFCs and SF6 | Securing customer trust through proactive measures to reduce PFC and SF6 emissions |
|
|
Strategy
One of our missions is to help realize global carbon neutrality by 2050. For this reason, we aim to reduce our own greenhouse gas emissions and achieve carbon neutral operations. We are also striving to ensure that our products help customers reduce their greenhouse gas emissions.
As part of efforts to reduce our own greenhouse gas emissions, we have set a 42% reduction target to be achieved by the fiscal year ending March 31, 2031 (based on the fiscal year ended March 31, 2023). After achieving this goal, we will proceed with efforts to achieve carbon neutrality by 2050 at the latest.
We are promoting our MMI Beyond Zero initiative to reduce customer greenhouse gas emissions based on the use of our products. Through this effort we are also working to reduce our Scope 3 emissions.
As important business strategies, we will continue to develop energy-saving, resource-saving, and durable products, while supplying parts for products and equipment that help combat climate change, such as electric vehicles, solar power equipment, and green data centers.
Scenario Analysis
Scenario analysis method
A scenario analysis was conducted using risks and opportunities identified in the fiscal year ended March 31, 2023.
The Sixth Assessment Report of the United Nations Intergovernmental Panel on Climate Change (IPCC) outlines several possible global warming forecasts for the next 30 years. We applied the IPCC's SSP1-1.9 (1.5°C) to a future scenario with a 1.5°C temperature rise, and the IPCC's SSP5-8.5 (4°C) to a future scenario with a 4°C temperature rise. Figure 2 shows the two scenarios: one with a 1.5°C temperature rise and the other with a 4°C rise.
Reference: Global average temperature rise forecasts based on three IPCC climate scenarios
Source: IPCC AR6 WGIP 30a) Global surface temperature change relative to 1850-1900
Figure 2: Future outlook based on two scenarios
| 4°C Scenario | 1.5°C Scenario | |
|---|---|---|
| Main Scenarios | SSP5-8.5 (Fossil-fuel based development) | SSP1-1.9 (Sustainable development) |
| Projected socioeconomic global changes | Rapid technological progress and development of human capital will lead to more competitive markets, and adaptation to climate change will play a central role. As an extension of the current situation, physical risks will have a significant impact on business operations. | By respecting environmental limits, nations will gradually move toward a sustainable path, and greatly advance climate change mitigation. It will be essential to respond to new technologies and markets, including those related to high efficiency, electrification, and optimistic scenarios the world is aiming for. |
| Environmental technology | Low | High |
| Laws and regulations | Less stringent | More stringent |
| Energy costs | High going forward (Petroleum resource depletion) | Increasing over the short term, decreasing over the long term (Expansion of renewable energy) |
| Flood risk | Frequent | Slight increase |
| Sea level rise | Major | Minor |
| Drought risk | Major | Minor |
| Population increase | High | Low |
| Consumption trends | Resource intensive, and reliance on fossil fuels | Dematerialization, and saving resources and energy |
| Other | Human capital development, competitive markets, and focus on innovation | Accelerating investment in education and health, and emphasizing public welfare over economic growth |
Projected financial impacts (see note)
Based on the scenario analysis, the graph in Figure 3 was created to show the potential level of financial impact on our company due to climate change (impact on operating income in fiscal 2030, assuming operating income achievement of 250 billion yen). The graph shows the degree of financial impacts from negative and positive factors, namely risks and opportunities. It also shows the impact of response measures taken to minimize negative impacts by mitigating the increased flood risk associated with more severe weather events.
Under the 1.5°C Scenario, the opportunity to enter new markets yields a projected profit of around 140 billion yen. This is larger than the 80 billion yen profit predicted under the 4°C Scenario, indicating the importance of fully seizing business opportunities.
Meanwhile, potential financial losses due to flood damage caused by more severe weather events was very clear in both the 4°C and 1.5°C Scenarios (approximately 130 to 160 billion yen). This is because 25 of our factories are located in areas with high or extremely high risk of river and/or coastal flooding, or droughts according to the Aqueduct Water Risk Atlas. We calculated the financial impact of potential flood damage at these 25 factories in terms of lost output, decreased sales, and repair expenditure. The results showed that the financial losses from flood risk are greater than the financial gains from potential opportunities in terms of increased sales alone. The analysis suggested a possibility that a terrible weather disaster caused by climate change may have a great impact on the Company's finances as the flood risk. The Group experienced a shutdown of two plants of the five that it owned at the time because of a flood occurred in the middle part of Thailand in 2011. Since then it has taken physical measures, including drawing up of a BCP and raising of waterproof banks and plant premises, against the flood risk. We are confident that we have now taken appropriate measures according to the degree of the flood risk at plants. We will follow up on the state of the measures and endeavor to improve the measures so that the flood risk will not be materialized.
Using the financial impact calculation method described in the note below, we calculated a large financial loss of over 100 billion yen based on flood risk. To mitigate this risk, as mentioned above, we have prepared a business continuity plan (BCP) and have taken physical disaster mitigation measures according to the risk level. We can confirm that measures are now in place to mitigate approximately 90% of the risks. Accordingly, we believe that such a large negative financial impact is unlikely to occur. However, these sober projections are still being shared to aid understanding of the business risks associated with climate change.
Based on the implementation of measures to mitigate flood damage risk, we expect positive operating income under the 1.5°C Scenario.
Figure 3. Financial Impact Levels Due to Risks, Opportunities, and Risk Mitigation Measures
Note: Financial impact calculation method
To calculate the financial impacts shown in Figure 3, parameters were determined for likely future developments under the 4°C and 1.5°C Scenarios, respectively. The impact calculations were based our current financial data (including sales by field and factory, and factory assets, etc.), along with WWF Risk Filter Suite, and growth forecasts for individual markets.
As for opportunities, the sales change forecast directly affects the profit level. With the risk of flooding and other water damage however, the negative financial impact appears to be large because the double impact of the resulting decrease in sales due to suspension of operations and the expenditure for repair costs.
Figure 4 show the assessed financial impacts based on the scenario analysis and the response measures.
Figure 4. Financial Impact assessment based on the scenario analysis and Response Measures
| Item | Impact on the business | Evaluation | Response measures to risks/opportunities | Applicable scenarios |
|---|---|---|---|---|
| Intensification of extreme weather events (supply chain disruption, and suspension of internal operations) | <1.5°C/4°C> Due to the potential for river flooding near our sites in Thailand, Cambodia, and China, repair costs and lost sales could occur. In addition, businesses in coastal areas of countries such as the Philippines could be similarly affected by disasters such as high tides and typhoons. |
★★★ |
Risks:
|
1.5°C/ 4°C |
| Carbon pricing (introduction of carbon taxes and emissions trading), carbon emission targets/policies of each country (increased costs due to policy responses) |
<1.5°C> Energy and greenhouse gas emissions costs will increase with the adoption of carbon taxes, emissions trading, and green electricity purchase requirements. At the same time, electricity prices are likely to decline in the future due to the widespread use of renewable energy. |
★ |
Risks:
|
1.5°C |
| Technology advancements associated with the transition to a low-carbon society |
<1.5°C> There is a growing need for products with outstanding energy-saving performance and those that help reduce greenhouse gas emissions. Those products that cannot keep pace with technological innovation will get eliminated. Responding to these issues will require costly technological development and R&D expenses. |
★★ |
Risks:
|
1.5°C |
| Resilience through risk mitigation |
<1.5°C> Climate change is expected to make major disasters more frequent, similar to past flooding in Thailand. With robust business continuity planning, we can enhance the appeal of our products to customers. <4°C> Climate change is expected to make major disasters even more frequent, similar to past flooding in Thailand. With robust business continuity planning, we can enhance the appeal of our products to customers. |
★ |
Opportunities:
|
1.5°C/ 4°C |
| Changes in product and service needs/New market entry | <1.5°C/4°C> As concern about climate change increases the adoption of electric vehicles, sales volumes for bearings, motors, and other key components for electric vehicles could increase substantially. As concern about climate change increases the adoption of electric vehicles, high-efficiency devices (such as drones and robots), and clean energy, sales volumes for bearings and other parts necessary for these products could increase substantially. |
★★ (1.5°C) ★ (4°C) |
Opportunities:
|
1.5°C/ 4°C |
| Profit | Costs | |
|---|---|---|
| ★★★ | 125.0 billion yen or more | 125.0 billion yen or more |
| ★★ | Between 62.5 billion yen and 125.0 billion yen | Between 62.5 billion yen and 125.0 billion yen |
| ★ | Less than 62.5 billion yen | Less than 62.5 billion yen |
Targets and Indicators
Targets
Greenhouse gas emissions (Scopes 1 & 2)
- Long-term target:
42% reduction by the fiscal year ending March 2031 compared to the fiscal year ended March 2023* - Ultimate targets:
Achieving net zero by 2050 at the latest
Greenhouse gas emissions (Scopes 3 Category 11<Use of sold products>)
- 25% reduction by the fiscal year ending March 2031 compared to the fiscal year ended March 2023*
Volume of avoided CO2 emissions by our products
- 4 million t-CO2 by the fiscal ending March 31, 2031 compared to the fiscal year ended March 2023
* Certified as an SBT
Indicators (fiscal year ended March 31, 2025)
- Scopes 1, 2 greenhouse gas emissions: 790,000 tons of CO2 (9.0% decrease year-on-year)
- Basic unit of sales for Scopes 1, 2 GHG emissions: 0.519 tons of CO2 / million yen (16.2% decrease year-on-year)
- CO2 emissions from power consumption: 700,000 tons of CO2 (9.0% increase year-on-year)
- PFC and SF6 emissions (CO2 equivalent): 48,000 tons of CO2 (20.4% decrease year-on-year)
- CO2 reduction based on use of our products: 7.69 million tons of CO2 (124% increase year-on-year)
* Scope2 is market-based.
Supply chain emissions (Scopes 1,2, & 3)
| '25/3 | Veri-fied | |||
|---|---|---|---|---|
| Scope1 | 90 | ● | ||
| Scope2 * | 700 | ● | ||
| Scope3 | 61,302 | ● | ||
| Category 1 | Purchased goods and services | 4,559 | ● | |
| Category 2 | Capital goods | 327 | ● | |
| Category 3 | Fuel-and energy-related activities (not included in scope 1 or scope 2) | 132 | ● | |
| Category 4 | Upstream transportation and distribution | 259 | ● | |
| Category 5 | Waste generated in operations | 15 | ● | |
| Category 6 | Business travel | 13 | ● | |
| Category 7 | Employee commuting | 50 | ● | |
| Category 8 | Upstream leased assets | — | ||
| Category 9 | Downstream transportation and distribution | 0.1 | ● | |
| Category 10 | Processing of sold products | 679 | ● | |
| Category 11 | Use of sold products | 55,259 | ● | |
| Category 12 | End-of-life treatment of sold products | 7.0 | ● | |
| Category 13 | Downstream leased assets | — | ||
| Category 14 | Franchises | — | ||
| Category 15 | Investments | 2.0 | ● | |
*: Market-base ●: Data Verified by Third party
Greenhouse gas emissions (Scopes 1 & 2)
CO2 emissions reduction based on use of our products
*Scope2: Market-based.