Consolidated Sales and Profit Forecast
Latest Update : Dec.1, 2025
* MinebeaMitsumi has adopted International Financial Reporting Standards (IFRS) from the 1Q of FY3/2019.
Forecast for the FY3/2026
The earnings forecast for the fiscal year ending March 2026 has been updated in light of the fact that the impact of U.S. tariffs has proven to be extremely limited, and the previously presented forecast range has been withdrawn and replaced with a single forecast. Progress in price-increase negotiations has also advanced, and the downside factors initially assumed are viewed as being contained to a certain extent.
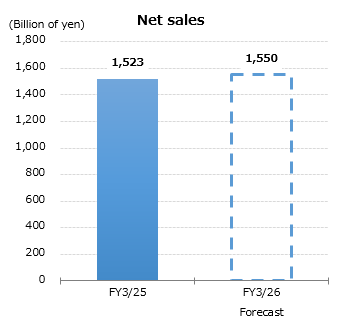
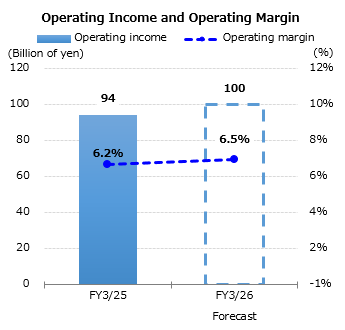
Business conditions have become sufficiently clear, and the earnings forecast is set at net sales of ¥1.55 trillion and operating profit of ¥100 billion. This fiscal year is expected to show stronger performance in the second half. In October, total company sales surpassed ¥160 billion, marking an excellent start to the second half. Sales in November and December are expected to remain robust, supporting the expectation that the forecast will be achieved.
| FY3/2025 Full Year Actual |
FY3/2026 | YoY Change |
||||
|---|---|---|---|---|---|---|
| 1H Actual |
2H Forecast |
Full Year Forecast |
||||
| Net sales | billions of yen | 1,522.7 | 778.3 | 771.7 | 1,550.0 | 1.8% |
| Operating income | billions of yen | 94.5 | 44.4 | 55.6 | 100.0 | 5.8% |
| Operating margin | % | 6.2% | 5.7% | 7.2% | 6.5% | |
| Profit before income taxes | billions of yen | 82.6 | 40.4 | 55.6 | 96.0 | 16.2% |
| Profit before income taxes margin | % | 5.4% | 5.2% | 7.2% | 6.2% | |
| Profit for the period attributable to owners of the parent | billions of yen | 59.5 | 28.6 | 42.4 | 71.0 | 19.4% |
| Profit for the period attributable to owners of the parent margin | % | 3.9% | 3.7% | 5.5% | 4.6% | |
| Earnings per share, basic (EPS) | yen | 147.58 | 71.18 | 105.62 | 176.80 | 19.8% |
Forecast for the Consolidated Sales and Operating Income by Business Segment
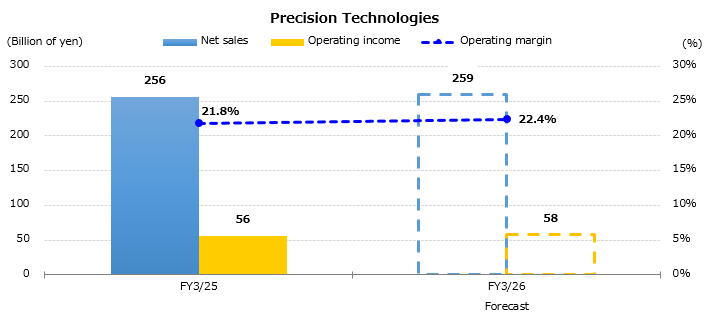
Precision Technologies (PT) segment is expected to continue performing steadily in the fiscal year ending March 2026. Bearing demand remains solid, supported by content expansion in the automotive sector and resilient demand from data centers regardless of cooling technology. Opportunities for high-performance bearings continue to expand, and ongoing productivity improvements are expected to enhance profitability. In the aircraft-related business, MinebeaMitsumi has been added to Boeing's qualified supplier list for aircraft fasteners for the 737 MAX and 787 Dreamliner programs, becoming the first certified supplier in Asia and supporting future demand. PMC also continues to perform well and is contributing to stable growth across the PT segment.
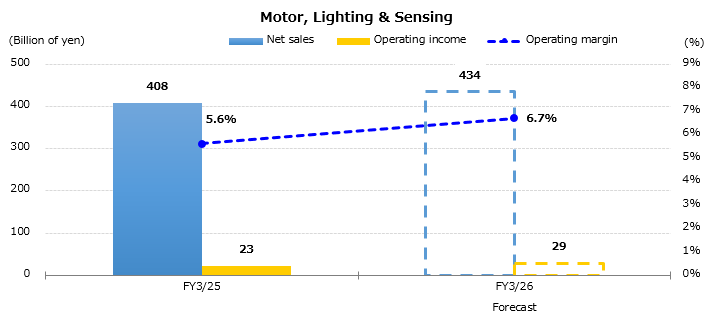
Motors, Lighting & Sensing (MLS) segment is benefiting from the expansion of the AI server market, which is creating increasing opportunities for the adoption of our products, including fan motors, HDD spindle motors, and various sensors. The AI server field is expected to remain a promising growth area over the medium to long term, and supply capabilities are being steadily reinforced to meet rising demand. In the Lighting Devices business, profitability has been restored, and mass production of new backlight technologies for pillar-to-pillar automotive displays has begun. As next-generation vehicles become more widespread, production volumes are expected to increase, driving earnings contributions toward the fiscal year ending March 2027.
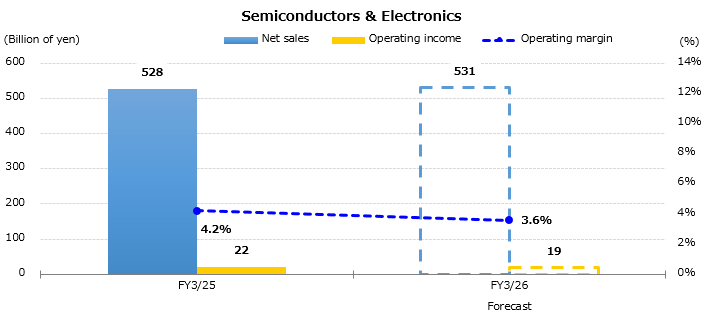
Semiconductors & Electronics (SE) segment continues efforts to secure orders to maximize production capacity at the Shiga Plant, while maintaining a solid level of profitability at the segment level. In the Optical Devices business, although rare earth restrictions continue to pose challenges, a recovery in demand is expected in the second half, and the shift toward rare earth-free products is progressing to strengthen supply stability. Mechanical Components are seeing robust customer demand, and productivity improvement initiatives are contributing to margin enhancement. Provided that foreign exchange fluctuations remain limited, further improvement in business performance is anticipated toward the fiscal year ending March 2026.
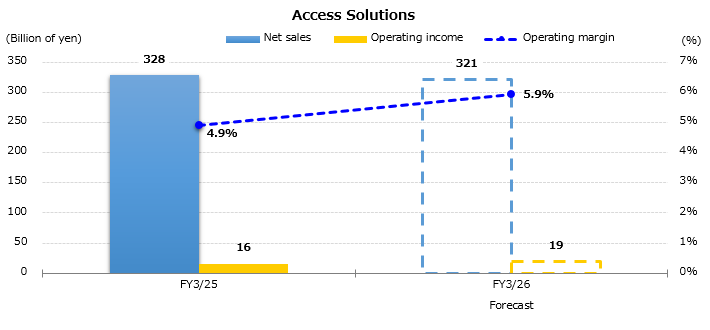
Access Solutions (AS) segment is making substantial progress in productivity improvement initiatives, particularly through significant yield gains in painting processes, which have resulted in a clear reduction in scrap and are expected to strengthen profitability in the second half. In addition, new product development and order expansion pursued since the management integration are beginning to deliver results, with mass production scheduled to begin sequentially from the second half of the fiscal year ending March 2026. Despite external uncertainties, including the slowdown in the European automotive market, the combined impact of productivity improvements and new product launches supports the expectation that the initial guidance will be achieved.
| FY3/2025 Full Year Actual |
FY3/2026 | YoY Change |
||||
|---|---|---|---|---|---|---|
| 1H Actual |
2H Forecast |
Full Year Forecast |
||||
| Net sales | billions of yen | 1,522.7 | 778.3 | 771.7 | 1,550.0 | 1.8% |
| Precision Technologies | billions of yen | 255.7 | 133.2 | 125.8 | 259.0 | 1.3% |
| Motor, Lighting & Sensing | billions of yen | 407.7 | 218.3 | 215.7 | 434.0 | 6.4% |
| Semiconductors & Electronics | billions of yen | 527.6 | 267.3 | 263.8 | 531.0 | 0.6% |
| Access Solutions | billions of yen | 328.1 | 157.8 | 163.2 | 321.0 | -2.2% |
| Others | billions of yen | 3.5 | 1.8 | 3.2 | 5.0 | 41.6% |
| Operating income | billions of yen | 94.5 | 44.4 | 55.6 | 100.0 | 5.8% |
| Precision Technologies | billions of yen | 55.7 | 28.7 | 29.3 | 58.0 | 4.1% |
| Motor, Lighting & Sensing | billions of yen | 23.0 | 12.4 | 16.6 | 29.0 | 30.5% |
| Semiconductors & Electronics | billions of yen | 22.0 | 9.6 | 9.4 | 19.0 | -13.6% |
| Access Solutions | billions of yen | 15.9 | 7.1 | 11.9 | 19.0 | 19.3% |
| Other | billions of yen | -1.2 | -0.9 | -1.1 | -2.0 | - |
| Adjustments | billions of yen | -20.9 | -12.6 | -10.4 | -23.0 | - |
Capital Expenditure, Depreciation, Research and Development Costs
| FY3/2025 Full Year Actual |
FY3/2026 Full Year Forecast |
YoY Change |
||
|---|---|---|---|---|
| Depreciation and amortization | billions of yen | 66.2 | 69.0 | 4.2% |
| Capital expenditures | billions of yen | 94.8 | 80.0 | -15.6% |
| R&D expenses | billions of yen | 45.5 | 45.6 | 0.2% |
Foreign Exchange
| FY3/2025 Full Year Actual |
FY3/2026 | ||||
|---|---|---|---|---|---|
| 1H Actual |
3Q-4Q Assumption |
||||
| USD | PL | yen | 152.61 | 146.25 | 140.00 |
| BS | yen | 149.52 | 148.88 | 140.00 | |
| EUR | PL | yen | 163.89 | 165.98 | 160.00 |
| BS | yen | 162.08 | 174.47 | 160.00 | |
| THB | PL | yen | 4.36 | 4.43 | 4.20 |
| BS | yen | 4.40 | 4.62 | 4.20 | |
| CNY | PL | yen | 21.12 | 20.26 | 19.40 |
| BS | yen | 20.59 | 20.88 | 19.40 | |


