


Results Summary
Latest Update : Nov.9, 2026
Back to Financial Results (FY3/2027)
Overview for 1H of FY 3/2027 (From April 1, 2026 to September 30, 2026)
During the six months ended September 30, 2026, the global economy remained resilient overall, although some regions were affected by soaring energy prices caused by prolonged tensions in the Middle East.
The Japanese economy saw a recovery in exports driven by growing semiconductor demand, and investment in labor-saving and digitalization initiatives remained firm. Personal consumption also remained resilient, supported by improvements in the employment and income environment. The U.S. economy saw corporate activity expand robustly, driven by strong AI-related investment and demand for data centers, and personal consumption also remained firm against the backdrop of a stable employment situation. The European economy saw only a limited recovery, as continued high energy prices weighed on growth despite a favorable employment situation and a pickup in exports to the U.S. Although the Chinese economy saw robust exports related to IT and EVs, it lacked momentum, weighed down by a prolonged correction in the real estate market and sluggish domestic demand. While the Southeast Asian economy showed resilience, supported by exports of electronic components, the economic recovery remained moderate due to stagnant public investment in the Philippines and a delayed recovery in tourism in Thailand.
Working against this backdrop, the MinebeaMitsumi Group (our "Group") concentrated on improving productivity, thoroughly cutting costs, creating high-value added products, developing new technologies, and enhancing its marketing approach to achieve sustainable growth and boost profitability further.
As a result, net sales increased by 112,437 million yen (14.4%) year on year to 890,751 million yen. Operating income increased by 13,678 million yen (30.8%) year on year to 58,065 million yen, profit before income taxes increased by 31,435 million yen (77.9%) to 71,805 million yen, and profit for the period attributable to owners of the parent increased by 22,420 million yen (78.4%) to 51,005 million yen.
Performance by Segment for 1H of FY 3/2027 (From April 1, 2026 to September 30, 2026)
In addition, some classifications between "Precision Technologies segment" and "Motor, Lighting & Sensing segment", as well as between "Semiconductor & Electronics segment" and "Access Solutions segment" have been changed from the first six months of the fiscal year. The segment information disclosed for the first six months of the previous year has been prepared based on the classification of reporting segments after the corporate organization change.
Precision Technologies Segment
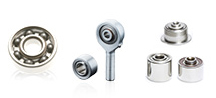
The main products in the Precision Technologies segment include our Group's anchor product line, ball bearings, in addition to mechanical components such as rod-end bearings used mainly in aircraft and hard disk drive (HDD) pivot assemblies, etc., fasteners for aircraft, and special devices. Sales of ball bearings, our Group's mainstay product, increased due to steady demand for servers for data centers. In addition, sales of rod-end bearings also increased due to growing demand for use in aircraft.
As a result, net sales increased by 30,116 million yen (22.0%) year on year to 166,840 million yen, and operating income increased by 10,625 million yen (36.1%) to 40,069 million yen.
Motor, Lighting & Sensing Segment
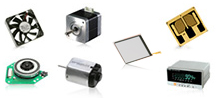
The main products in the Motor, Lighting & Sensing segment include electronic devices such as LED backlights for LCDs and smart products, as well as HDD spindle motors, sensing devices (measuring components), stepping motors, DC motors, fan motors, and automotive motors. Sales increased mainly due to an increase in demand for HDD spindle motors and fan motors for solar power generation.
As a result, net sales increased by 39,262 million yen (18.3%) year on year to 254,020 million yen, and operating income increased by 5,591 million yen (48.1%) to 17,224 million yen.
Semiconductor & Electronics Segment
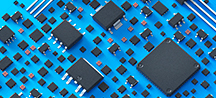
The main products in Semiconductor & Electronics segment include semiconductor devices, optical devices, mechanical components, and power supply components. Sales increased mainly due to an increase in sales of optical devices.
As a result, net sales increased by 27,317 million yen (10.2%) year on year to 294,567 million yen, and operating income increased by 1,556 million yen (16.2%) to 11,159 million yen.
Access Solutions Segment
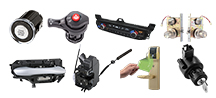
The main products in the Access Solutions segment include key sets, door latches, door handles, and other automotive components as well as industrial equipment components. Although sales increased due to an increase in automobile production by major customers, operating income decreased due to structural reforms in Europe.
As a result, net sales increased by 15,021 million yen (9.5%) year on year to 172,788 million yen, while operating income decreased by 3,802 million yen (52.9%) to 3,386 million yen.
Other Business Segment
Software design and development, and machines produced in-house are the main products in our Other business segment. Net sales increased by 721 million yen (39.7%) year on year to 2,536 million yen, and operating loss narrowed by 212 million yen to 668 million yen.
In addition to the figures noted above, 13,105 million yen in corporate expenses, etc. not attributable to any particular segment is indicated as adjustments. The total amount of adjustments was 12,601 million yen for the same period of the previous fiscal year.
Analysis of Financial Position for 1H of FY 3/2027 (From April 1, 2026 to September 30, 2026)
Assets, Liabilities, and Net Assets
Our Group sees "strengthening our financial position" as a top priority and is taking various steps, such as efficient controlling of capital investments, asset management, and reducing interest-bearing debt. We will reform our portfolio to increase the weight of our highly profitable core businesses and engage in highly effective M&A, promoting an appropriate and flexible financial strategy.
Total assets at the end of the six months were 1,874,059 million yen, an increase of 59,222 million yen from the end of the previous fiscal year. The main reason for this was an increase in inventories, other financial assets and property, plant and equipment.
Total liabilities at the end of the six months were 933,051 million yen, an increase of 29,245 million yen from the end of the previous fiscal year. The main reason for this was an increase in trade and other payables.
Equity amounted to 941,008 million yen, and the equity ratio attributable to owners of the parent was 49.6%, an increase of 0.1 percentage points from the end of the previous fiscal year.
Condition of Cash Flows
Cash and cash equivalents at the end of the six months were 233,708 million yen, an increase of 6,186 million yen from the end of the previous fiscal year.
Cash flows from each business activity during the six months ended September 30, 2026, and relevant factors were as follows:
Net cash provided by operating activities amounted to 74,224 million yen (compared to 22,342 million yen in the same period of the previous fiscal year). This was primarily due to profit before income taxes, depreciation and amortization, and changes in inventories and trade and other payables. Net cash used in investing activities amounted to 55,089 million yen (compared to 37,216 million yen in the same period of the previous fiscal year). This was primarily due to purchase of property, plant and equipment. Net cash used in financing activities amounted to 10,627 million yen (compared to 18,392 million yen provided by financing activities in the same period of the previous fiscal year). This was primarily due to dividends paid.
The content of this page is based on information included in the "Brief Report of Financial Results for Second Quarter of Fiscal Year Ending March 2027 (From April 1, 2026 to September 30, 2026)" announced on November 6, 2026.