


Information by Region and User Industry
Latest Update : Feb.16, 2024
* MinebeaMitsumi has adopted International Financial Reporting Standards (IFRS) from the 1Q of FY3/2019.
- Anuual
- Quarter
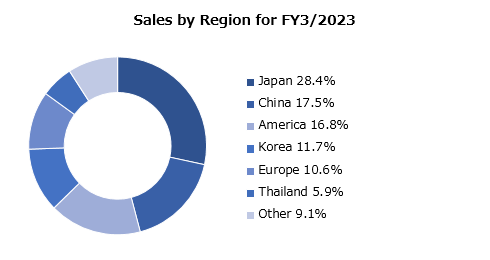
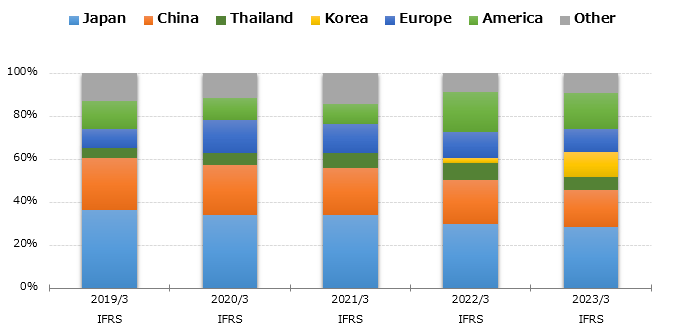
Sales by Region
| FY3/2019 | FY3/2020*2 | FY3/2021*3 | FY3/2022 | FY3/2023*4 | ||
|---|---|---|---|---|---|---|
| Japan | millions of yen | 321,317 | 331,587 | 337,830 | 334,076 | 367,067 |
| Distribution Ratio | % | 36.3% | 33.9% | 34.2% | 29.7% | 28.4% |
| China | millions of yen | 213,558 | 229,921 | 215,471 | 233,051 | 225,878 |
| Distribution Ratio | % | 24.1% | 23.5% | 21.8% | 20.7% | 17.5% |
| Thailand | millions of yen | 43,059 | 54,709 | 66,365 | 86,487 | 76,009 |
| Distribution Ratio | % | 4.9% | 5.6% | 6.8% | 7.7% | 5.9% |
| Korea | millions of yen | - | - | - | 29,427 | 150,755 |
| Distribution Ratio | % | - | - | - | 2.6% | 11.7% |
| Europe | millions of yen | 77,193 | 150,538 | 134,737 | 134,484 | 137,320 |
| Distribution Ratio | % | 8.7% | 15.4% | 13.6% | 12.0% | 10.6% |
| America | millions of yen | 115,671 | 97,349 | 91,525 | 210,765 | 216,938 |
| Distribution Ratio | % | 13.1% | 9.9% | 9.3% | 18.7% | 16.8% |
| Other*5 | millions of yen | 113,925 | 114,340 | 142,496 | 95,850 | 118,236 |
| Distribution Ratio | % | 12.9% | 11.7% | 14.4% | 8.6% | 9.1% |
| Total | millions of yen | 884,723 | 978,445 | 988,424 | 1,124,140 | 1,292,203 |
| Distribution Ratio | % | 100.0% | 100.0% | 100.0% | 100.0% | 100.0% |
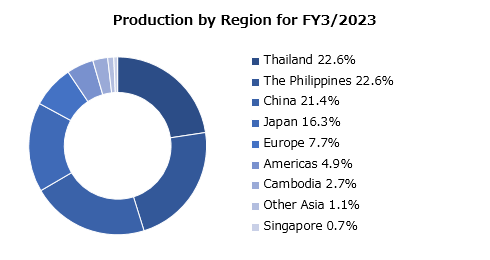
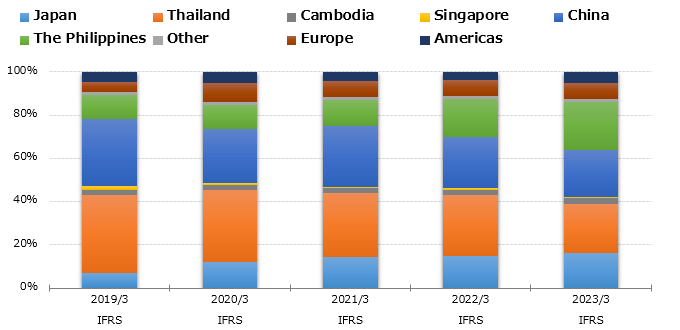
Production by Region
| FY3/2019*1 | FY3/2020*2 | FY3/2021*3 | FY3/2022 | FY3/2023*4 | ||
|---|---|---|---|---|---|---|
| Japan | millions of yen | 59,865 | 120,560 | 142,591 | 170,122 | 210,950 |
| Distribution Ratio | % | 6.8% | 12.3% | 14.4% | 15.1% | 16.3% |
| Thailand | millions of yen | 319,901 | 325,864 | 293,936 | 317,399 | 291,645 |
| Distribution Ratio | % | 36.2% | 33.3% | 29.7% | 28.2% | 22.6% |
| Cambodia | millions of yen | 22,495 | 18,358 | 19,991 | 25,176 | 35,256 |
| Distribution Ratio | % | 2.5% | 1.9% | 2.0% | 2.2% | 2.7% |
| Singapore | millions of yen | 15,999 | 9,484 | 7,110 | 8,572 | 8,505 |
| Distribution Ratio | % | 1.8% | 1.0% | 0.7% | 0.8% | 0.7% |
| China | millions of yen | 237,748 | 243,218 | 278,383 | 265,661 | 277,018 |
| Distribution Ratio | % | 30.9% | 24.9% | 28.2% | 23.6% | 21.4% |
| The Philippines | millions of yen | 96,068 | 112,456 | 118,699 | 200,135 | 291,832 |
| Distribution Ratio | % | 10.9% | 11.5% | 12.0% | 17.8% | 22.6% |
| Other | millions of yen | 13,608 | 13,863 | 12,310 | 12,784 | 14,054 |
| Distribution Ratio | % | 1.5% | 1.4% | 1.2% | 1.2% | 1.1% |
| Asia (excluding Japan) | millions of yen | 741,819 | 723,243 | 730,429 | 829,727 | 918,309 |
| Distribution Ratio | % | 83.9% | 73.9% | 73.9% | 73.8% | 71.1% |
| Europe | millions of yen | 42,002 | 82,593 | 72,688 | 81,561 | 99,320 |
| Distribution Ratio | % | 4.8% | 8.4% | 7.4% | 7.3% | 7.7% |
| Americas | millions of yen | 41,036 | 52,047 | 42,716 | 42,729 | 63,623 |
| Distribution Ratio | % | 4.6% | 5.3% | 4.3% | 3.8% | 4.9% |
| Total | millions of yen | 884,723 | 978,445 | 988,424 | 1,124,140 | 1,292,203 |
| Distribution Ratio | % | 100.0% | 100.0% | 100.0% | 100.0% | 100.0% |
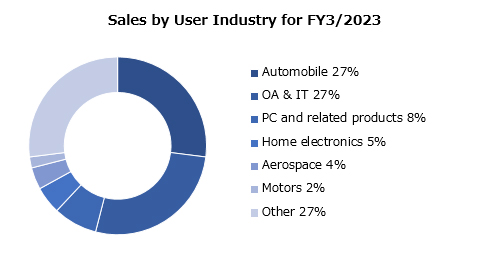
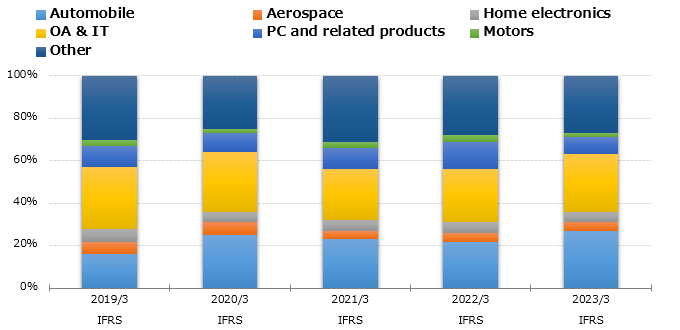
Sales by User Industry
| FY3/2019 | FY3/2020*2 | FY3/2021 | FY3/2022 | FY3/2023 | ||
|---|---|---|---|---|---|---|
| Automobile | % | 16% | 25% | 23% | 22% | 27% |
| Aerospace | % | 6% | 6% | 4% | 4% | 4% |
| Home electronics | % | 6% | 5% | 5% | 5% | 5% |
| OA & IT | % | 29% | 28% | 24% | 25% | 27% |
| PC and related products | % | 10% | 9% | 10% | 13% | 8% |
| Motors | % | 3% | 2% | 3% | 3% | 2% |
| Other | % | 30% | 25% | 31% | 28% | 27% |
| Total | % | 100% | 100% | 100% | 100% | 100% |
- *1 Due to review of calculation method, production by region of FY3/2019 was changed.
- *2 U-Shin Ltd. has been included in the scope of consolidation since April 10, 2019. In 1Q of FY3/2020, Access Solutions does not include April 1-9.
- *3 ABLIC Inc. has been included in the scope of consolidation since April 30, 2020.
- *4 We have included the following companies in the scope of consolidation;
HONDA TSUSHIN KOGYO CO., LTD. since September 16, 2022
Minebea Connect Inc. (formerly SUMIKO TEC CO., LTD.) since November 1, 2022
Minebea AccessSolutions Inc. (formerly Honda Lock Mfg. Co., Ltd.) since January 27, 2023 - *5 Others include Korea until the end of the FY ended March 31, 2021.


